Prices for March 31st, 2010
| HEATING OIL cents per gallon | | MONTH | HIGH | LOW | SETTLE | CHANGE | | APR | 217.00 | 212.00 | 216.46 | up 03.99 | | MAY | 218.20 | 212.66 | 217.90 | up 04.74 | | JUN | 219.34 | 214.24 | 219.08 | up 04.71 | | JUL | 221.01 | 216.60 | 220.76 | up 04.69 | | AUG | 222.61 | 218.50 | 222.55 | up 04.66 | | SEP | 222.61 | 220.31 | 224.37 | up 04.58 | | OCT | 224.40 | 222.70 | 226.31 | up 04.54 | | NOV | 226.35 | 224.00 | 228.40 | up 04.54 | | DEC | 227.81 | 225.97 | 230.50 | up 04.53 | | JAN | 230.58 | 228.62 | 232.49 | up 04.51 | | FEB | 232.45 | 231.75 | 233.58 | up 04.55 | | MAR | 233.58 | 231.07 | 233.75 | up 04.61 | | Estimated Volume (day before) total all prev day 93,139 | | NYMEX CRUDE OIL dollars per barrel | | MONTH | HIGH | LOW | SETTLE | CHANGE | | MAY | 83.85 | 82.22 | 83.76 | up 01.39 | | JUN | 84.27 | 82.63 | 84.18 | up 01.41 | | JUL | 84.65 | 83.04 | 84.57 | up 01.40 | | AUG | 84.84 | 83.33 | 84.84 | up 01.38 | | SEP | 85.04 | 83.75 | 85.03 | up 01.36 | | OCT | 85.27 | 84.00 | 85.19 | up 01.35 | | | | | | | | | Estimated Volume… 420,070 Opec Basket…$78.21 up $0.44
Prompt #2 Oil NYH 88..-0.50 to -0.25, 74 Lo S…+4.75 to +5.25
US Gulf 88 grade…-4.00 to -3.50, 74 grade Lo S…-1.00 to -0.50 Group .........+6.75 to +7.00 Lo S.....+6.75 to +7.00
Chicago ......+1.75 to +2.00 cash quotes by Dow Jones | | | |
| NYMEX RBOB GASOLINE cents per gallon | | MONTH | HIGH | LOW | SETTLE | CHANGE | | APR | 232.12 | 227.06 | 231.00 | up 03.53 | | MAY | 230.95 | 226.45 | 230.72 | up 03.51 | | JUN | 230.40 | 226.00 | 230.13 | up 03.42 | | JUL | 229.57 | 225.40 | 229.38 | up 03.52 | | AUG | 227.91 | 224.86 | 228.34 | up 03.54 | | SEP | 227.25 | 223.83 | 227.00 | up 03.55 | | OCT | 216.46 | 212.41 | 216.21 | up 03.62 | | NOV | 214.55 | 213.16 | 214.52 | up 03.63 | | Estimated RB Volume day before 80,493 | | NYMEX NATURAL GAS dollars per mmBtu | | MONTH | HIGH | LOW | SETTLE | CHANGE | | MAY | 4.079 | 3.853 | 3.869 | dn 0.104 | | JUN | 4.164 | 3.950 | 3.965 | dn 0.097 | | JUL | 4.265 | 4.070 | 4.082 | dn 0.084 | | AUG | 4.345 | 4.150 | 4.163 | dn 0.079 | | | Estimated Volume…day before (162,198)
Nymex statistics are based on composite Access & Day Sessions
Prompt Gasoline NYH M5 -13.00 to -12.00 RBOB +6.75 /+7.25
US Gulf M4: -13.00 to -12.50 RBOB -4.00 to -3.50
L.A. Conv Reg 230.00-231.00, N-grade Group 221.50-222.00 Chi 223.95-224.20 | |
Market Review for Wednesday
RUDE oil prices were higher again on Wednesday, with the May contract breaking and closing above the critical resistance at $83.18. In the process, crude oil finished yesterday at its highest level in 17 months.
The buying came largely on a weaker US dollar, after a disappointing jobs number by ADP convinced investors that ultra-low interest rates will persist in the US beyond previous expectations. Some of the buying seems to have come on the “good vibrations” that we have discussed recently in our daily reports, or the vague sense that the economic recovery is gaining momentum, despite continuing weakness in employment, and that that should lead to heavier demand for oil products. Normally, higher equities prices round out the bullish picture, but investors found the jobs data disappointing, as well. Still the timing of this advance is odd. The DJIA lost more than 50 points. Crude oil stocks increased by more than had been expected, distillate stocks dropped by a little less than expected and gasoline stocks dropped by substantially less than
| Fuel for Thought Petroleos Mexicanos, commonly called “Pemex,” is looking to increase production after six years of decline and stagnation. Halting the decline in output at the huge Canterell field has been an important part of the equation, but new projects and heavier investment have also helped with the Mexican revitalization of its life-blood industry. After years of relative neglect, Mexican output dropped from 3.4 million barrels a day in 2004 to 2.61 million bpd in 2009. But, this year, it plans to invest $19 billion in addition to giving performance-based contracts to oil companies capable of reinvigorating production efficiently and over a number of years. |
expected – and established a new 17-year high-water mark for March. Refinery utilization was also up significantly more than was forecast. Taken alone, some of these factors would have been enough to dampen the bulls’ enthusiasm. Taken together, it really is surprising that the bulls were able to break prices above major resistance.
In the final analysis, the trend, buy-stops over $83.18, and the general sense that the economy is coming out of recession were enough to propel prices higher. We are not sure what role, if any, the strong seasonal tendency for higher prices (at this time of year) may have played, but we have noted before that it always seems to be something moving prices higher after early March.
Automatic Data Processing (ADP) releases a ‘preview’ of the more significant unemployment figures released by the Labor Department each month, and yesterday’s sneak peak, while not necessarily in line with the government statistics, showed an unexpected decline in employment for March. ADP reported the loss of 23,000 jobs, as opposed to estimates for a gain of 40,000. But, if that was the market’s reaction to a disappointing report … .
Technicals
Crude Oil:
Crude oil prices broke over $83.18 yesterday, printing their highest intraday prices since January 11th. There is still resistance at $83.95, and a break over that would give us the highest print since ending at $86.59 on October 9th, 2008.
Dollars per barrel
Crude oil prices broke and settled above $83.18, but they still have major resistance at $83.95.
May crude oil now has buy-stops over $83.95, $84.83, $85.13, $89.82, $90.99, $93.02, $96.03, and $100.37. Sell-stops are under $82.00-$82.20, $80.00-$80.15, $79.40, $78.85, $78.00, $77.00, $76.30, $73.70, $72.60, $71.30, $70.75, $69.30, $68.55, $68.00, $65.80-$66.20, and $64.95. A break over $84.00 would point to $90.00 and even $94.85 technically.
Football: The bears lost 14 more yards yesterday on fourth and 29 and that officially gives the bulls a first down.
May crude oil Support: $82.00-$82.20, $81.75-$81.85, $79.85-$80.00, $79.40-$79.55, $78.85-$79.00.
Resistance: $83.85-$83.95, $84.75-$84.85, $85.00-$85.15, $89.75-$89.85, $90.85-$91.00.
Heating Oil:
Heating oil prices broke and settled over resistance at 214.42, triggering a swing objective to 234.23. The next major resistance is at 222.72, first, though. Prices have broken to the upside of their range and have reimposed the trend higher.
May heating oil has buy-stops over 218.20, 222.72, 225.80, 227.05, 229.08, 234.25, 238.95, 249.62, and 251.50. Sell stops are under 212.65, 212.00, 210.90, 207.65, 204.95, 202.50, 201.55, 200.55, 199.00, 196.40, 190.75, 189.95, 187.45, 186.50, 182.63, 177.00, 176.68, and 173.75.
May heating oil Support: 212.65-212.75, 212.00-212.15, 211.50-211.60, 207.65-207.80, 204.95-205.10.
Resistance: 217.90-218.20, 217.45-217.55, 222.65-222.72, 225.65-225.80, 226.90-227.05.
Heating oil prices were higher yesterday, and they decisively broke above important resistance at 214.42, breaking to the upside of their trading range. The next resistance is at 222.72. Prices have an objective to 234.23.
Gasoline:
Gasoline prices broke above 231.50 yesterday, but they could not settle above 231.50. It is a small amount that will probably be made up today or next week. A settle above 231.50 would confirm a swing objective to 266.10.
May RBOB has buy-stops over 231.50, 232.12, 240.10, 250.40, 252.00, 265.10, 267.85, and 270.85. Sell-stops are under 227.00, 225.50, 221.40, 218.95, 215.50, 213.70, 203.80, 202.25, 198.40, 191.85, 187.00, 184.15, 182.40, 181.20, 179.20, 177.30, and 175.14.
Gasoline prices were higher again yesterday, and they broke 231.34 and 231.50, but could not settle above those levels. A settle above 231.50 would give us a swing objective to 266.10. The trend higher has all but been completely reinstated.
May Rbob Support: 227.00-227.15, 225.50-225.60, 221.40-221.55, 220.00-220.15, 218.95-219.15.
Resistance: 231.35-231.50, 232.00-232.15, 239.85-240.10, 250.25-250.40, 251.80-252.00.
Oil Inventory Reports
This was the ninth consecutive stock build in crude oil stocks, and it tipped the balance in gasoline stocks to the build side. Distillate stocks were lower, turning six out of eight into six out of nine higher. It was the largest increase in refinery utilization since 2003, when usage jumped 2.5% to 91.0%. All things considered, it was more a bearish report than a bullish one. We would also note that a year ago, crude oil stocks were 48.2 mln bbls (15.49%) higher than in 2008, distillate stocks were 35.4 mln bbls (32.54%) higher and gasoline stocks were 6.4 mln bbls (2.87%) lower.
DOE History: Distillate stocks have fallen in six of the last eight years, by an average of 1.738 mln bbls. The eight-year average is a draw of 1.276 mln bbls (last week’s average draw was 1.266 mln bbls). Gasoline stocks fell in four of the last eight years, for a four-year average draw of 4.200 mln bbls. The eight-year average was a draw of 0.897 mln bbls. Crude oil stocks have been higher in all of the last eight years for an eight-year average build of 5.080 mln bbls. Utilization has been higher in four of the last eight years and has an eight-year average increase of 0.024%, with an eight-year average utilization figure of 87.28%. The four-year, pre-hurricane utilization average was 90.30%. Since Katrina, refineries have run at an average utilization rate of 84.25%. Crude oil imports have been higher in four of the last six years, and the average crude oil import figure over the last six years has increased 381,000 bpd. The average crude oil import figure over the last six years has been 10.113 million bpd. Imports were 0.716 mln bpd below that figure in last week’s report.
This Week’s Inventory Comparison: Distillate stocks are now 0.5 million bbls, or 0.35%, higher than a year ago. Heating oil inventories are 4.9 mln bbls, or 13.32%, higher than they were a year ago. Gasoline stocks are 8.4 mln bbls (up 3.88%) higher against a year ago. Crude oil stocks are now 9.5 million bbls, or 2.61%, lower than a year ago. Residual stocks are 0.9 mln bbls (2.31%) lower than a year ago, jet fuel stocks are 0.2 mln bbls, (0.48%) higher than a year ago. Utilization is 0.90% higher than a year ago and 4.68% below the eight-year average. It is 7.70% lower than the four-year, pre-Katrina average and 1.65% below the average of the four years since the big hurricanes (Katrina & Rita) in 2005.
This Week’s Demand: Four-week, total refined products demand came in at 19.211 million bpd, down 0.149 mln bbls on the week, and up 0.535 mln bpd and 2.86% against a year ago, reportedly. Seven weeks ago, it was 0.159 mln bpd and 0.83% lower than a year ago. Four-week gasoline demand is at 8.997 mln bpd, up 1.53%, compared to down 1.26% six weeks ago. It was up 44,000 bpd on the week. Four-week distillate demand is now at 3.716 mln bpd, down 0.96%, compared to down 9.08% eight weeks ago. Four-week jet demand is now at 1.369 mln bpd, down 4.26% against a year ago, compared to up 8.17% 12 weeks ago. Four-week residual fuel demand is at 0.593 mln bpd, down 0.34%, compared to up 25.96% three weeks ago. Propane use is down 1.02% to 1.166 mln bpd, compared to 1.330 mln bpd (up 7.34%) a week ago. These numbers were mixed in comparison with a week ago.
This Week’s API Report: This week’s API report showed a mild build of 0.421 mln bbls in crude oil stocks, a lighter-than-forecast draw of 1.007 mln bbls in distillate stocks and a smaller-than-expected draw of 0.946 mln bbls in gasoline inventories. Utilization was up 1.3% to 82.1%. Implied demand came in at a respectable 9.569 mln bpd in gasoline (after two strong weeks) and at 4.061 mln bpd in distillate. Crude oil imports dropped 279,000 bpd to 9.203 mln bpd. This week’s figures fell short of expectations everywhere, except for utilization.
DOE Weekly Inventory Statistics
| Category | Final DOE Estimate
This Week’s Estimate | History
Last Year’s Report | Most Recent Changes
This Week’s DOE Report | Versus A Year Ago
Millions of Barrels |
| Distillate | dn 1.00 to 1.50 mln bbls | up 0.221 | dn 1.085 mln bbls | up 0.500 |
| Gasoline | dn 2.75 to 3.25 | up 2.225 | up 0.313 | up 8.400 |
| Crude oil | up 4.00 to 5.00 | up 2.844 | up 2.929 | dn 9.500 |
| Utilization | up 0.0% to 0.3% | dn 0.3% at 81.7% | up 1.50% at 82.60% | |
| Crude Imports | up 0.000 to 0.500 mmbd | up 0.170 to 9.554 | dn 0.337 to 9.060 mln bpd | |
| DOE Distillate Demand | 3.646 mln bpd | dn 163,000 | Gasoline Demand | 9.060 mln bpd | dn 027,000 |
| DOE Distillate Production | 3.575 mln bpd | dn 125,000 | Gasoline Production | 9.036 mln bpd | up 012,000 |
| DOE Distillate Imports | 0.321 mln bpd | up 153,000 | Gasoline Imports | 0.710 mln bpd | up 087,000 |
Source: US Department of Energy’s Energy Information Administration
Open Interest Analysis
Crude oil open interest fell by 13,481 contracts on Tuesday, when prices were up. That looks like short-covering, which would be bearish.
Heating oil open interest fell by 3,476 contracts on Tuesday, when prices were higher. That looks like short-covering and would be bearish.
RBOB open interest fell by 3,001 contracts on Tuesday, when prices were higher, which looks like net short covering, which would be mildly bearish. Since March 1st , open interest is up 51,360 contracts.
Natural gas open interest grew by 1,248 on Tuesday, when prices were higher. That looks like new buying, which would be supportive.
Tuesday’s Open Interest Changes:
Crude 1,283,846 dn 13,481 Heat 319,299 dn 3,476 RBOB 313,127 dn 3001 Nat gas 814,092 up 2,678
CFTC Commitments of Traders for Nymex (Forensic analysis for the period ended Tuesday, March 23rd)
Crude oil prices dropped $0.06/bbl over the latest reporting period, and the best selling came from Managed Money long liquidation. These accounts – funds – liquidated 11,042 longs and added 1,802 new shorts. Producers also liquidated heavily, more than funds, but not on a net basis. Producers kicked out 33,031 existing longs, but they also covered 31,640 existing shorts. Swap Dealers were buying into the weakness, adding 11,410 new longs against just 199 new shorts. Other Reportables, which include commission houses, liquidated 283 existing longs and covered 903 existing shorts. Fund liquidation ‘allowed’ prices to decline (they were heavy buyers for weeks) and Producer liquidation was also a major factor pushing prices lower.
In heating oil futures, prices lost 1.25 cents a gallon, and the best net selling came from Managed Money accounts, which liquidated 4,074 existing longs and covered 2,687 shorts. Other Reportables added 36 new longs and added 1,398 new shorts. Producers added 1,468 longs and covered 1,462 existing shorts. And Swap Dealers added 566 new longs and 198 new shorts. Here, as well, managed money or fund liquidation helped push quotes lower – after powering them higher for weeks.
Gasoline prices fell 1.22 cents a gallon during the period under review. Managed Money accounts liquidated 2,850 existing longs and added 1,384 new shorts. The others, which had been sellers, were buying. Producers added 11,054 longs and 8,782 shorts. Swap Dealers added 755 longs and covered 215 shorts. Other Reportables added 1,781 longs and covered 153 shorts.
In natural gas, prices dropped 21.7 cents during the period under review. Managed Money accounts added 4,025 new longs against the sale of 2,467 new shorts. Other Reportables added 6,198 longs and 6,746 shorts. Producers added 2,768 longs and 355 shorts. Swap Dealers liquidated 2,643 longs and sold 356 new shorts. Swap Dealers were the best net sellers, after weeks of fund selling against everyone else’s buying. Commission houses were the best gross sellers, although they bought nearly as much. Only Swap Dealers are net long here (24 longs per short) with funds holding three shorts for each long.
Natural Gas & Utility Generation
Natural gas prices gave back the gains recorded on Tuesday, as selling returned to the market. There was decent buying at prices beginning with the $3 handle, but any bargain-hunting dried up the minute prices popped above $4.00/mmBtu.
Traders keep coming back to the heavy production from shale formations, light industrial demand and reasonably well-supplied storage facilities. Certainly, there is no imminent threat of there being any kind of tightness or regional shortage. As far as natural gas traders are concerned, daily output is generous, temperature forecasts suggest lower consumption and storage levels already offer a fairly decent cushion in this market. We still believe that there will be a sudden reappraisal at some point in this market, but we are not yet seeing any signs of that.
The National Oceanic & Atmospheric Administration (NOAA) said yesterday that temperatures in April will come in warmer-than-normal in the Northeast, below-normal in the West, along the US Gulf Coast and in Florida. And it will be a toss-up in the Central Plains, from Montana to Texas. All of the private forecasters are calling for moderate readings, starting today and extending out into the middle of April, now. As a result, the weather, which is almost always the single, biggest source of fundamental motivation, does not seem likely to push prices anywhere but lower.
It amazes us that the oil market has been able to advance on the vaguest sense that the economy will improve, while natural gas seems to be assuming the exact opposite. It almost does not seem to matter what kind of economic news we may see; it has become an article of faith that any bullish silver lining will help oil prices while any lingering doubt on the economy will attach itself to the natural gas market. Prices are oversold and undervalued, but it does not seem to matter, here.
As we noted yesterday, it really is not about storage or weather or charts anymore. Prices have to find their level, and once they have, prices will rally dramatically and without warning. Commercials with deep pockets are buying on a scaled-down basis here. One needs patience and financial staying power. Because so few have both, the final phase of the decline will include the exit of those who just can’t hold on.
In cash trading yesterday, Henry Hub prices were at $3.70-$3.97, down $0.07 and up $0.12 on the day (DJN). SoCal prices were at $3.78-$4.04, up $0.04-$0.19 on the day. El Paso Permian prices were up $0.04-$0.10/mmBtu to $3.62-$3.85. Katy prices were up $0.07-$0.13 to $3.77-$3.90. Waha prices were up $0.05-$0.06 at $3.65-$3.84. Transco 6 was up $0.07-$0.10 to $4.17-$4.35/mmBtu, according to Dow Jones News (DJN).
Palo Verde prices were last quoted at $34.00-$38.55/mwh. Northeastern prices last traded at $30.00-$37.50. Cinergy was last at $30.00-$31.00. Ercot was last at $34.25-$35.25/mwh.
Support is at $3.82-$3.86, $3.73-$3.75, $3.66-$3.68, $3.50-$3.53, $3.44-$3.46, $3.28-$3.32, $2.91-$2.93, $2.80-$2.82, $2.74-$2.75, and $2.69-$2.70. Resistance is at $4.07-$4.08, $4.14-$4.18, $4.29-$4.30, $4.36-$4.37, $4.44-$4.47, $4.59-$4.63, $4.76-$4.79, $4.86-$4.89, $4.97-$5.00, $5.16-$5.17, $5.46-$5.47, $5.55-$5.60, $5.87-$5.90, $5.99-$6.03, $6.09-$6.11, $6.15-$6.17, $6.34-$6.37, $6.65-$6.69, $6.90-$6.94, $7.01-$7.04, $7.28-$7.31, and $7.34-$7.36.
May Natural Gas: Support : $3.82-$3.86, $3.73-$3.75, $3.66-$3.68, $3.50-$3.53, $3.44-$3.46, $3.28-$3.32.
Resistance: $4.07-$4.08, $4.14-$4.18, $4.36-$4.37, $4.44-$4.47, $4.59-$4.63, $4.76-$4.79.
Natural gas prices gave back Tuesday’s gains yesterday.
Dollars per million Btu
The crude to gas ratio ended at 21.65-to-one yesterday. It was its highest ratio since 9-11-10, when it reached 23.41-to-one.
Ratio
EIA Weekly Storage Figures
Last week’s EIA report showed a build of 11 bcf on expectations for a build of 9-11 bcf. Stocks are now 28 bcf lower than a year ago, against a deficit of 40 bcf a week ago, a deficit of 71 bcf two weeks ago and a deficit of 71 bcf three weeks ago. Stocks are now 1.69% lower than a year ago. They are 121 bcf and 8.04% above the five-year average.
For this week, the eight-year average (of similar Friday reports) was a draw of 10.00 bcf. The five-year average was a draw of 6.4 bcf. Last year’s storage number was unchanged. Over the last eight years, five years showed draws, two years showed builds, and last year showed no change. Expectations are for a build of 14 bcf today.
EIA Report
| Region | 03-19-10 | 03-12-10 | Change | Last Year | 5 Yr Avg |
| Cons East | 760 | 770 | dn 10 | 666 | 696 |
| Cons West | 285 | 283 | up 02 | 280 | 228 |
| Producing | 581 | 562 | up 19 | 707 | 581 |
| Total US | 1626 | 1615 | up 11 | 1654 | 1505 |
Bcf, or Billions of cubic feet. Source: Energy Information Administration, US Department of Energy
News & Views
In trading on Globex last night, May crude oil prices were up $0.63 to $84.39, at 8:30 AM EDT. May heating oil prices were up 1.70 cents to 2.1960/gallon. Gasoline prices were up 1.29 cents to 2.3201/gallon. May natural gas, was down 0.004 to $3.865/mmBtu. The US dollar was higher this morning, so the market did not even have that pushing quotes higher. We would have expected more to push prices over $83.18 yesterday – and then over $83.95 this morning. It seems that a vague sense that the recovery is gathering steam, the technical picture, with prices over those resistance levels and the seasonal have done all the heavy lifting in this market.
 SThe Labor Department reported this morning that 6,000 fewer Americans applied for unemployment in the week ended March 27th. That places the number of Americans applying at 439,000. The number of those receiving benefits remained roughly the same while the figure on extended benefits increased.
The larger, monthly report for March, will be released tomorrow, and analysts are projecting the addition of 180,000 jobs in the report. Most markets will be closed in Europe and the US, and it may be the first factor for consideration on Monday.
SChina’s manufacturing sector expanded for a 13th consecutive month, it was reported this morning. The Purchasing Managers’ Index in China rose to 55.1 in March, up from 52.0 in February. At the same time, Europe’s manufacturing sector reportedly increased at its fastest pace in more than three years, with the UK manufacturing index reaching its highest level in 15 years. Manufacturing in Germany expanded at its fastest rate in 14 years, the data this morning showed.
SOrders placed at US factories in February increased for the 10th time in the last 11 months, Bloomberg reported yesterday, citing the Commerce Department. At the same time, inventories and backlogs climbed by their greatest amount in a year, both signs that manufacturing will be a source of strength in the months ahead. Orders increased by 0.6% in February, following a revised but sizzling gain of 2.5% in January.
We wish our readers the best for a safe and enjoyable Easter.
It looks like the weather is going to cooperate across large tracts of the country, and we wish everyone the best during this special spring holiday.
Our next report will be out on Monday,
with exchanges closed tomorrow in observance of Good Friday.
An Illustrated Look at Energy Market Factors
A Look at the US Dollar Versus the Euro
 Dollar-Euro (dollar in euro cents): Three-Month Bar-Chart
 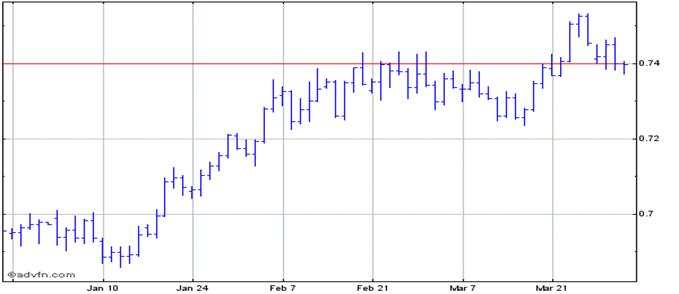 The US dollar found tried to move higher Tuesday night and early Wednesday morning, but it failed to follow through on the upside and it sold off into its close. By the end of trading, the dollar was lower, largely on a disappointing jobs preview by ADP. We will see the official, government-generated figure before the week ends. Yesterday’s dollar weakness pushed oil prices higher yesterday.
http://www.x-rates.com/d/EUR/USD/graph120.html
A Look at the Dow Jones Industrial Average (djia)
Dow Jones Industrial Average: One-Year Chart
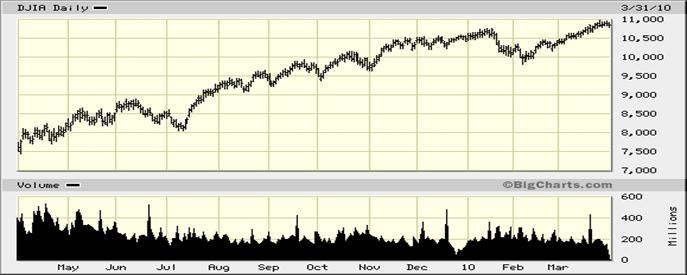
The DJIA ended with a loss of 50.79 points yesterday, as the stock market pulled back from its recent highs. A disappointing jobs ‘preview’ from ADP seems to have been one of the major factors in yesterday’s profit-taking by longs.
Source: http://bigcharts.marketwatch.com/quickchart/quickchart.asp?symb=DJIA&sid=1643
Recommendations for Specific Market Segments
Heating Oil Distributors Heating oil prices burst above their major resistance at 214.42 yesterday, leaving 222.72 as their next major area of resistance. At this stage, it looks like it will not take much to push prices higher. Fundamentally, this week’s DOE report was disappointing in a number of ways across a number of products. Nevertheless, with only a weaker US dollar to guide prices, the bulls were buying in force, and that gave us a technical breakout which now seems to be working on its own momentum higher. We cannot downplay the relevance of the seasonal tendency for higher prices. If there is one bullish factor on a day when there are nine other bearish factors, this market will find and react to the bullish one. Diesel Users We would hold our caps here., and would add to them. NYH Ultra Low Sulfur Diesel.…223.90-224.40 plus 6.250 USG Ultra Low Sulfur Diesel.…221.15-221.65 plus 3.500 Jet/Kerosene Users & Airlines New York Harbor cash market differentials were 7.25 to 7.75 cents over January heating oil in NY Harbor and 1.25 to 1.75 over the screen in the US Gulf. Diesel & Gasoline Marketers We would stay hedged here as we start the week. Gasoline Blenders & End-Users Prices look bullish again, so we would hold and add to long bias holdings. Prompt NYH Fuel Ethanol…..164.00-166.00 Prompt USG Fuel Ethanol….157.00-159.00 Quotes from 03-30-10 Heating Oil End-Users We want to hold what we have here, and we would add to them. Speculators We bought calls through March 15th. We would hold them and add to them here. Refiners The 7:5+2 crack spread was $11.52 yesterday. This time of year is when crack spreads typically strengthen. Crude Oil Producers Crude oil prices have broken over $83.18 and $83.95, which gives us objectives to $94.85. There is psychological resistance at $90. | Prompt Jet Fuel Prices New York Harbor 225.15-225.65 US Gulf 219.15-219.65 Midwest (Group Three) 220.45-221.45 Midwest (Chicago) 222.90-223.90 Los Angeles 222.00-223.00 San Francisco 222.00-223.00 Portland, Oregon 222.00-223.00 Cents per gallon Propane Prices Mont Belvieu……….…..non-TET………$1.113000 Cents per gallon 
Spot Ethanol prices have support from 150.00 to 157.00. It looks like it will take an extended period to turn this market back up, again. Prices are following corn more than oil. |