Prices for April 6th, 2010
| HEATING OIL cents per gallon | | MONTH | HIGH | LOW | SETTLE | CHANGE | | MAY | 228.22 | 225.71 | 226.83 | up 00.08 | | JUN | 229.73 | 227.29 | 228.53 | up 00.28 | | JUL | 231.50 | 229.10 | 230.46 | up 00.37 | | AUG | 233.36 | 231.03 | 232.51 | up 00.52 | | SEP | 235.31 | 233.54 | 234.63 | up 00.69 | | OCT | 237.31 | 235.55 | 236.77 | up 00.82 | | NOV | 238.85 | 237.64 | 238.87 | up 00.89 | | DEC | 241.40 | 238.89 | 240.94 | up 00.98 | | JAN | 242.83 | 241.92 | 242.89 | up 01.00 | | FEB | 243.69 | 242.99 | 243.79 | up 01.00 | | MAR | 243.99 | 243.12 | 243.79 | up 01.00 | | APR | 242.33 | 241.75 | 242.49 | up 01.05 | | Estimated Volume (day before) total all prev day 81,506 | | NYMEX CRUDE OIL dollars per barrel | | MONTH | HIGH | LOW | SETTLE | CHANGE | | MAY | 87.09 | 86.13 | 86.84 | up 00.22 | | JUN | 87.59 | 86.63 | 87.39 | up 00.26 | | JUL | 88.06 | 87.14 | 87.94 | up 00.32 | | AUG | 88.45 | 87.50 | 88.37 | up 00.39 | | SEP | 88.71 | 87.78 | 88.67 | up 00.44 | | OCT | 88.89 | 88.34 | 88.86 | up 00.46 | | | | | | | | | Estimated Volume… 476,047 Opec Basket…$81.31 up $1.38
Prompt #2 Oil NYH 88..-2.75 to -2.25, 74 Lo S…+2.75 to +3.25
US Gulf 88 grade…-4.50 to -4.00, 74 grade Lo S…-2.50 to -2.00 Group .........+5.25 to +5.75 Lo S.....+5.25 to +5.75
Chicago ......+1.00 to +1.50 cash quotes by Dow Jones | | | |
| NYMEX RBOB GASOLINE cents per gallon | | MONTH | HIGH | LOW | SETTLE | CHANGE | | MAY | 235.60 | 233.35 | 234.83 | dn 00.19 | | JUN | 235.60 | 233.20 | 234.99 | up 00.06 | | JUL | 235.25 | 233.50 | 234.85 | up 00.32 | | AUG | 234.70 | 233.29 | 234.51 | up 00.59 | | SEP | 233.81 | 232.43 | 233.72 | up 00.79 | | OCT | 223.07 | 221.73 | 223.61 | up 01.08 | | NOV | 221.74 | 221.68 | 222.43 | up 01.25 | | DEC | 222.63 | 219.73 | 222.36 | up 01.33 | | Estimated RB Volume day before 81,176 | | NYMEX NATURAL GAS dollars per mmBtu | | MONTH | HIGH | LOW | SETTLE | CHANGE | | MAY | 4.334 | 4.066 | 4.096 | dn 0.181 | | JUN | 4.421 | 4.159 | 4.189 | dn 0.182 | | JUL | 4.530 | 4.280 | 4.307 | dn 0.180 | | AUG | 4.593 | 4.370 | 4.401 | dn 0.174 | | | Estimated Volume…day before (210,665)
Nymex statistics are based on composite Access & Day Sessions
Prompt Gasoline NYH M5 -7.25 to -6.75 RBOB +5.00 /+5.50
US Gulf M4: -13.50 to -13.00 RBOB -3.50 to -3.00
L.A. Conv Reg 235.00-236.00, N-grade Group 225.10-225.60 Chi 228.10-228.25 | |
Market Review for Tuesday
T was a generally quiet trading day on Tuesday, and prices just meandered higher on momentum. Investors were not shaken by a stronger US dollar, although it was not that long ago that we saw a higher dollar push oil prices back from an early attempt to break resistance between $83.00 and $84.00. Now that prices are above those levels, the dollar seems to have lost some of its ability to shock investors out of long commodities positions.
Traders were talking yesterday about the bailout package for Greece, again, which seems to have been the main ingredient in the weaker US dollar. There was also talk about the most recent FOMC minutes, which seem to suggest that interest rates will be kept at or near record low levels a while longer.
The minutes noted: “While recent data pointed to a noticeable pickup in the pace of consumer spending during the first quarter, participants agreed that household spending going forward was likely to remain constrained by weak labor market
| Fuel for Thought The DOE released its Short-Term Energy Outlook yesterday, and it once again increased its price forecast for the year, based on continuing economic recovery. The DOE now sees WTI at an average price of $80.74, up 0.85% from its estimate last month of $80.06/bbl. The DOE forecasts global oil consumption to come in at 85.5 million bpd, down slightly from last month’s estimate of 85.51 million bpd. If that turns out to be the case, it would represent an increase of 1.7% from last year’s total of 84.04 million bpd. At the same time, the DOE sees demand climbing 0.1% from last month’s forecast for 2011, to 87.11 million bpd. |
conditions, lower housing wealth, tight credit, and modest income growth.” It seems that fewer members of the Fed were pushing for an earlier movement away from record low interest rates. The fact that this information was available yesterday – and that the dollar still rallied – was unusual. The FOMC minutes suggest that US interest rates will remain lower for longer, the dollar ignored that and rallied, and then oil ignored the uptick in the US dollar.
The DJIA did not pick up the slack, either. It ended Tuesday’s session at 10,969.99, tantalizingly near 11,000, and down 3.56 points on the day. We would have to view its influence as minimal. It seems that investors were encouraged that it has been able to loiter at the numbers it has recently without selling off. Usually, prices either break through decisively or back away in the hope of regathering forces for another push higher. There is a strange confidence that prices will break 11,000 without needing to marshal forces.
Last evening’s API report should have given prices an upward bias in trading overnight, although Globex prices dropped in gasoline in the hour after the report came out, while they stayed effectively the same in heating oil and crude.
Technicals
Crude Oil:
Crude oil prices traded within their tightest daily trading range in weeks, but they ended with minor gains and they continue to have a swing objective to $92.23 and could reach $94.85 before all is said and done.
Dollars per barrel
Crude oil prices traded inside one of their tightest ranges this year, but still finished with gains. There is an objective to $92.23.
May crude oil now has buy-stops over $87.10, $89.82, $90.99, $93.02, $96.03, and $100.37. Sell-stops are under $86.00, $85.00, $83.20, $82.00-$82.20, $80.00-$80.15, $79.40, $78.85, $78.00, $77.00, $76.30, $73.70, $72.60, $71.30, $70.75, $69.30, $68.55, $68.00, $65.80-$66.20, and $64.95. We now have an objective to $92.23.
Football: The bulls gained two yards on first down yesterday, and that makes it second and eight to go, here.
May crude oil Support: $86.00-$86.15, $85.00-$85.15, $83.20-$83.35, $82.00-$82.20, $81.75-$81.85.
Resistance: $86.90-$87.10, $87.35-$87.50, $89.75-$89.85, $90.85-$91.00, $92.10-$92.25.
Heating Oil:
Heating oil prices made slightly higher new, recent highs yesterday, but the trading was light and the day’s range was extremely tight. Prices remained above critical resistance (it was resistance) and still has an upside objective to 234.23. Buy-stops are now over 228.25.
May heating oil has buy-stops are now over 228.25, 229.08, 234.25, 238.95, 249.62, and 251.50. Sell stops are under 225.70, 222.50, 216.60, 212.65, 212.00, 210.90, 207.65, 204.95, 202.50, 201.55, 200.55, 199.00, 196.40, 190.75, 189.95, 187.45, 186.50, 182.63, 177.00, 176.68, and 173.75.
May heating oil Support: 225.70-225.85, 222.50-222.65, 216.60-216.75, 212.65-212.75, 212.00-212.15.
Resistance: 226.90-227.05, 228.10-228.25, 228.95-229.10, 234.10-234.25, 238.80-238.95.
Cents per gallon
Heating oil prices were slightly higher yesterday, and they remain above critical resistance levels, with a swing objective to 234.23.
Gasoline:
Gasoline prices were slightly lower yesterday, but the trend higher remains in place. We still have a swing objective to 266.10. It is possible that prices will move even higher from here.
May RBOB has buy-stops over 235.60, 240.10, 250.40, 252.00, 265.10, 267.85, and 270.85. Sell-stops are under 233.00, 227.00, 225.50, 221.40, 218.95, 215.50, 213.70, 203.80, 202.25, 198.40, 191.85, 187.00, 184.15, 182.40, 181.20, 179.20, 177.30, and 175.14.
Cents per gallon
Gasoline prices finished near unchanged yesterday, but they remain above important resistance and still have objectives to 266.10. The seasonal tendency seems to be filling in the blanks in this market’s bullish ledger.
May Rbob Support: 233.00-233.10, 229.40-229.55, 227.00-227.15, 225.50-225.60, 221.40-221.55.
Resistance: 235.45-235.60, 236.65-236.75, 239.85-240.10, 250.25-250.40, 251.80-252.00.
Oil Inventory Reports
We have had nine consecutive builds in crude oil stocks, and it looks like the odds are in favor of there being another build in this week’s report. Six out of the last eight years have generated stock builds for this same week. And, after last week’s unexpectedly strong increase in refinery utilization (of 1.5%, to 82.60%), we enter this week with a similarly strong chance of there being another increase in utilization this week. Seven out of the last eight years (this corresponding week) have shown utilization increases. The average increase over the last eight years has come out to a gain of 1.46%.
DOE History: Distillate stocks have dropped in five out of the past eight years, by an average of 3.106 mln bbls. The eight-year average is a draw of 1.616 mln bbls. Gasoline stocks fell in five of the last eight years, for a five-year average draw of 3.360 mln bbls. The eight-year average was a draw of 1.700 mln bbls. Crude oil stocks have been higher in six of the last eight years for a six-year average build of 2.667 mln bbls and an eight-year average build of 1.288 mln bbls. Utilization has been higher in seven of the last eight years and has an eight-year average increase of 1.46%, with an eight-year average utilization figure of 88.74%. The four-year, pre-hurricane utilization average was 92.78%. Since Katrina, refineries have run at an average utilization rate of 84.70%. Crude oil imports have been lower in five of the last six years, and the average crude oil import figure over the last six years has fallen by 115,000 bpd. The average crude oil import figure over the last six years has been 9.768 million bpd. Imports were 0.708 mln bpd below that figure in last week’s report.
Last Week’s Inventory Comparison: Distillate stocks are now 0.5 million bbls, or 0.35%, higher than a year ago. Heating oil inventories are 4.9 mln bbls, or 13.32%, higher than they were a year ago. Gasoline stocks are 8.4 mln bbls (up 3.88%) higher against a year ago. Crude oil stocks are now 9.5 million bbls, or 2.61%, lower than a year ago. Residual stocks are 0.9 mln bbls (2.31%) lower than a year ago, jet fuel stocks are 0.2 mln bbls, (0.48%) higher than a year ago. Utilization is 0.90% higher than a year ago and 4.68% below the eight-year average. It is 7.70% lower than the four-year, pre-Katrina average and 1.65% below the average of the four years since the big hurricanes (Katrina & Rita) in 2005.
Last Week’s Demand: Four-week, total refined products demand came in at 19.211 million bpd, down 0.149 mln bbls on the week, and up 0.535 mln bpd and 2.86% against a year ago, reportedly. Seven weeks ago, it was 0.159 mln bpd and 0.83% lower than a year ago. Four-week gasoline demand is at 8.997 mln bpd, up 1.53%, compared to down 1.26% six weeks ago. It was up 44,000 bpd on the week. Four-week distillate demand is now at 3.716 mln bpd, down 0.96%, compared to down 9.08% eight weeks ago. Four-week jet demand is now at 1.369 mln bpd, down 4.26% against a year ago, compared to up 8.17% 12 weeks ago. Four-week residual fuel demand is at 0.593 mln bpd, down 0.34%, compared to up 25.96% three weeks ago. Propane use is down 1.02% to 1.166 mln bpd, compared to 1.330 mln bpd (up 7.34%) a week ago. These numbers were mixed in comparison with a week ago.
This Week’s API Report: This week’s API report showed a mild build of 1.070 mln bbls in crude oil stocks, an unexpected build 0.723 mln bbls in distillate stocks and a bigger-than-expected draw of 2.957 mln bbls in gasoline inventories. Utilization was up 2.6% to 84.7%. Implied demand came in at a strong 9.835 mln bpd in gasoline (three of four strong weeks now) and at 4.056 mln bpd in distillate. Crude oil imports were up 737,000 bpd to 9.940 mln bpd. This week’s report was bullish for gasoline – through inventories – but higher imports and utilization rates could mean higher output in future numbers.
DOE Weekly Inventory Statistics
| Category | Final DOE Estimate
This Week’s Estimate | History
Last Year’s Report | Most Recent Changes
This Week’s DOE Report | Versus A Year Ago
Millions of Barrels |
| Distillate | dn 1.00 to 1.50 mln bbls | up 0.221 | dn 1.085 mln bbls | up 0.500 |
| Gasoline | dn 2.75 to 3.25 | up 2.225 | up 0.313 | up 8.400 |
| Crude oil | up 4.00 to 5.00 | up 2.844 | up 2.929 | dn 9.500 |
| Utilization | up 0.0% to 0.3% | dn 0.3% at 81.7% | up 1.50% at 82.60% | |
| Crude Imports | up 0.000 to 0.500 mmbd | up 0.170 to 9.554 | dn 0.337 to 9.060 mln bpd | |
| DOE Distillate Demand | 3.646 mln bpd | dn 163,000 | Gasoline Demand | 9.060 mln bpd | dn 027,000 |
| DOE Distillate Production | 3.575 mln bpd | dn 125,000 | Gasoline Production | 9.036 mln bpd | up 012,000 |
| DOE Distillate Imports | 0.321 mln bpd | up 153,000 | Gasoline Imports | 0.710 mln bpd | up 087,000 |
Source: US Department of Energy’s Energy Information Administration
Open Interest Analysis
Crude oil open interest grew by 3,702 contracts on Monday, when prices were up. That looks like new buying and it suggests that the big funds are back on the buy side. Open interest has jumped 49,244 contracts in three sessions.
Heating oil open interest grew by 1,965 contracts on Monday, when prices were higher. That looks like new buying and is supportive.
RBOB open interest grew by 632 contracts on Monday, when prices were higher, which looks like good new buying, and would be bullish. Since March 1st , open interest is up 58,889 contracts.
Natural gas open interest grew by 5,330 on Monday, when prices were higher. That looks like new buying and is supportive.
Monday’s Open Interest Changes:
Crude 1,333,090 up 3,702 Heat 324,153 up 1,965 RBOB 320,039 up 632 Nat gas 837,529 up 5,330
CFTC Commitments of Traders for Nymex (Forensic analysis for the period ended Tuesday, March 30th)
Crude oil prices rallied $0.46/bbl over the latest reporting period, and the only net buying came from Managed Money accounts, which added 9,483 new longs and covered 2,420 old shorts. Swap Dealers (added 1,833 longs) and Producers (added 1,660 longs) both added longs, but they both sold substantially more, adding 5,196 new shorts and 5,213 new shorts, respectively. Other Reportables liquidated 1,219 longs and added 5,449 new shorts. Managed Money accounts hold 4.98 longs for every short, while Swap Dealers hold 1.68 longs for each short. Producers hold 2.38 shorts for each long. Other Reportables hold 1.77 shorts for every long. Swap Dealers have been on the sell side lately, and funds have pushed quotes up.
In heating oil futures, prices gained 2.29 cents a gallon and, while there was short-covering from other sources, the best net buying came from Managed Money accounts, which added 3,521 longs and covered 3,187 shorts. Other Reportables covered 930 shorts and liquidated 168 longs, and Producers covered 4,505 shorts while liquidating 10,974 longs. Swap Dealers liquidated 3,345 longs and added 98 new shorts. It was Managed Money buying and short-covering that pressed prices up.
Gasoline prices rose 1.19 cents a gallon during the period under review. Here, it was Swap Dealer buying and short-covering (added 457 longs and covered 180 shorts) and Producers covered more shorts (4,233 shorts) against the liquidation of just 2,014 longs. Other Reportables liquidated 774 longs and added 1,070 new shorts into the advance.
In natural gas, prices dropped 21.7 cents during the period under review. This time, though, it was Swap Dealers and Other Reportables liquidating longs (8,615 and 5,554 respectively) against the covering of just 48 shorts (Swap Dealers) and 579 shorts by Other Reportables. Producers added 5,942 longs and 3,398 shorts while Managed Money accounts took profits, adding 5,868 longs and covering 8,381 shorts. They effectively got Swap Dealers and commission houses to throw in the towel on their long positions. Managed Money accounts engineered the selling by the others, and were booking profits.
Natural Gas & Utility Generation
Natural gas prices ended their two-day advance with profit-taking and fresh selling yesterday. It was one of the first significant rallies in weeks, and that is theoretically what producers are looking for – opportunities to sell future production at higher prices. They have been buying into weakness, for weeks now, instead. While they did not want to terminate the fledgling rally, the opportunity to hedge forward output may have been too compelling for some to let pass, at least entirely. Most of the selling was long liquidation/profit-taking.
Fundamentally, temperatures are warming (and are warm from a seasonal perspective), stocks are average to well-supplied, and demand is still lower than normal. Having said that, though, this market has yet to discount the reduction in storage levels from late October, and it has yet to receive any kind of boost from signs that the global economy is improving. While crude oil is near triple where it was at its lows in December, 2008, natural gas prices have only moved sideways or lower. Crude oil prices have gained at least $40 a barrel on the assumption that an economic recovery will increase demand for refined products; natural gas has not gained a dime, yet – unless we count the very recent rally.
The EIA is predicting an increase in daily production of 2 bcf a day or 0.7%, to 60.9 bcf a day, in 2010, as a result of continuing gains in the rig count. The number of active rigs stands at 949, up about a quarter from the numbers seen as we ended the fourth quarter. That is certain to increase drilling activity as we move through the year. And, demand is unlikely to rise dramatically until baseload industrial use increases with economic activity. Weather-related demand is almost certainly over for the winter, and we are not going to see any air-conditi0ning generation needs until we get into summer proper.
In cash trading yesterday, Henry Hub prices were at $4.09-$4.20, up $0.02-$0.22 on the day (DJN). SoCal prices were at $4.18-$4.33, up $0.13-$0.29 on the day. El Paso Permian prices were up $0.00-$0.28/mmBtu to $4.05-$4.15. Katy prices were up $0.01-$0.24 to $4.06-$4.13. Waha prices were up $0.10-$0.28 at $4.04-$4.15. Transco 6 was up $0.27-$0.29 to $4.50-$4.63/mmBtu, according to Dow Jones News (DJN).
Palo Verde prices were last quoted at $36.00-$38.00/mwh. Northeastern prices last traded at $36.55-$65.75. Cinergy was last at $34.00-$37.50. Ercot was last at $35.15-$36.00/mwh.
Support is at $4.00-$4.02, $3.81-$3.86, $3.73-$3.75, $3.66-$3.68, $3.50-$3.53, $3.44-$3.46, $3.28-$3.32, $2.91-$2.93, $2.80-$2.82, $2.74-$2.75, and $2.69-$2.70. Resistance is $4.27-$4.29, $4.34-$4.37, $4.44-$4.47, $4.59-$4.63, $4.76-$4.79, $4.86-$4.89, $4.97-$5.00, $5.16-$5.17, $5.46-$5.47, $5.55-$5.60, $5.87-$5.90, $5.99-$6.03, $6.09-$6.11, $6.15-$6.17, $6.34-$6.37, $6.65-$6.69, $6.90-$6.94, $7.01-$7.04, $7.28-$7.31, and $7.34-$7.36.
May Natural Gas: Support : $4.00-$4.02, $3.81-$3.86, $3.73-$3.75, $3.66-$3.68, $3.50-$3.53, $3.44-$3.46.
Resistance: $4.27-$4.29, $4.34-$4.37, $4.44-$4.47, $4.59-$4.63, $4.76-$4.79, $4.86-$4.89.
Natural gas prices sold off yesterday on profit-taking.
Dollars per million Btu
The crude to gas ratio was at 21.20-to-one yesterday.
Ratio
EIA Weekly Storage Figures
Last week’s EIA report showed a build of 12 bcf on expectations for a build of 14 bcf. Stocks are now 16 bcf lower than a year ago, against a deficit of 28 bcf a week ago, a deficit of 40 bcf two weeks ago and a deficit of 71 bcf three weeks ago. Stocks are now 0.96% lower than a year ago. They are 160 bcf and 10.82% above the five-year average.
For this week, the eight-year average (of similar Friday reports) was a build of 5.62 bcf. The five-year average was a build of 8.6 bcf. Last year, there was a build of 20 bcf. Over the last eight years, five years showed builds and three years showed draws. Last week, the surveyed expectations were for a build of 14 bcf.
EIA Report
| Region | 03-26-10 | 03-19-10 | Change | Last Year | 5 Yr Avg |
| Cons East | 753 | 760 | dn 07 | 644 | 664 |
| Cons West | 289 | 285 | up 04 | 282 | 226 |
| Producing | 596 | 581 | up 15 | 728 | 588 |
| Total US | 1638 | 1626 | up 12 | 1654 | 1478 |
Bcf, or Billions of cubic feet. Source: Energy Information Administration, US Department of Energy
News & Views
 In trading on Globex last night, May crude oil prices were down $0.51 to $86.33, at 7:30 AM EDT. May heating oil prices were down 1.41 cents to 2.2542/gallon. Gasoline prices were down 0.95 cents to 2.3388/gallon. May natural gas, was up 0.013 to $4.109/mmBtu. The US dollar continued to advance in trading overnight and into this morning, and that sapped strength from commodities. Chinese real estate stocks dropped on fears of renewed credit-tightening by China’s central bank.
Traders seem to have ignored last night’s API inventory headlines, which immediately highlighted the larger-than-expected drawdown in gasoline stocks. The report also showed a large increase in crude oil imports and a jump in refinery utilization which could work together to give us more processed refined products in the weeks ahead.
 In trading overnight, commodities had received a boost from the latest growth projection for the Chinese economy. Crude oil prices tried to move higher, but reportedly ran into difficulty in their attempt to break above $87.00. When it became clear that prices were not going to break above that level, profit-taking set in and short-term traders started selling short. The end result was that oil prices were lower just before trading started in New York this morning.
The US Coast Guard reported the spillage of 18,000 gallons of crude oil from the Cypress pipeline, affecting the Delta National Wildlife Refuge off the Louisiana coast. The pipeline is owned by BP and Chevron. This comes at the worst possible time for the industry, which survived Hurricanes Katrina, Rita, Gustav and Ike without spills. The Obama Administration is considering opening up lands and coastal areas to drilling, and this will now become exhibit “A” in the fight against opening any new areas. Its timing could not have been worse.
An Illustrated Look at Energy Market Factors
A Look at the US Dollar Versus the Euro
 Dollar-Euro (dollar in euro cents): Three-Month Bar-Chart
 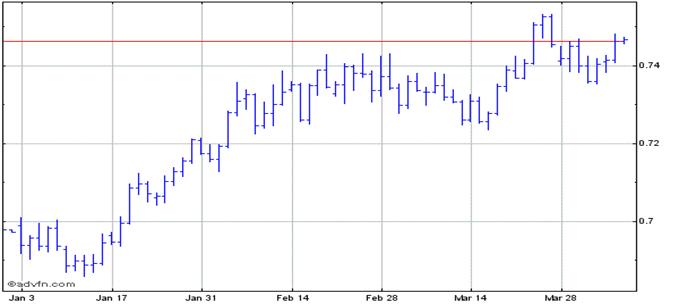 The US dollar was higher yesterday, and prices finished under the day’s highs. In early trading last night, the dollar kept inside a very tight trading range. Strength in the dollar has not had as big an impact on oil prices as weakness has.
http://www.x-rates.com/d/EUR/USD/graph120.html
A Look at the Dow Jones Industrial Average (djia)
Dow Jones Industrial Average: Six-Month Chart
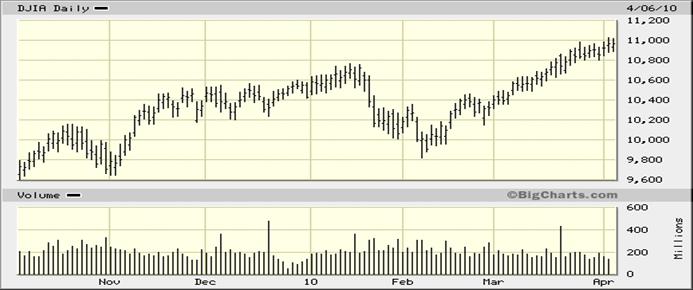
The DJIA traded over 11,000 yesterday, but they could not finish above that psychologically important figure – yet. The DJIA lost 3.56 points to end at 10,969.99 yesterday.
Source: http://bigcharts.marketwatch.com/quickchart/quickchart.asp?symb=DJIA&sid=1643&o_symb=DJIA&freq=1&time=7
Recommendations for Specific Market Segments
Heating Oil Distributors Heating oil prices were slightly higher yesterday, but they sold off in trading overnight, and will react to this morning’s DOE report, next. Last night’s API report was disappointing, and only the gasoline inventory figure came in better than expected. Of particular concern fundamentally, last night’s API report showed a second consecutive increase in refinery utilization, which suggests that refineries will be coming back sooner from exceptionally low levels during the first quarter. Refiners had the rare opportunity to rotate units in and out of service this winter, for the first time in decades. Despite potentially bearish fundamental factors, this market continues to benefit from the general sense that the economy is improving, and it seems to pick and choose – picking bullish factors. Diesel Users We would hold our caps here., and would add to them. NYH Ultra Low Sulfur Diesel.…231.10-231.60 plus 4.500 USG Ultra Low Sulfur Diesel.…228.10-228.60 plus 1.500 Jet/Kerosene Users & Airlines New York Harbor cash market differentials were 6.50 to 7.00 cents over January heating oil in NY Harbor and 1.50 to 2.00 over the screen in the US Gulf. Diesel & Gasoline Marketers We would stay hedged here. Gasoline Blenders & End-Users Prices look bullish again, so we would hold and add to long bias holdings. Prompt NYH Fuel Ethanol…..160.00-163.00 Prompt USG Fuel Ethanol….152.00-155.00 Quotes from 04-06-10 Heating Oil End-Users We want to hold what we have here, and we would add to them. Speculators We bought calls through March 15th. We would hold them and add to them here. Refiners The 7:5+2 crack spread was $10.83 yesterday. This time of year is when crack spreads typically strengthen. Crude Oil Producers Crude oil prices are still above major resistance and they now have swing objectives to $92.23, and possibly as high as $94.85. | Prompt Jet Fuel Prices New York Harbor 233.35-233.85 US Gulf 228.35-228.85 Midwest (Group Three) 232.10-234.10 Midwest (Chicago) 231.85-232.85 Los Angeles 234.00-235.00 San Francisco 234.00-235.00 Portland, Oregon 234.00-235.00 Cents per gallon Propane Prices Mont Belvieu……….…..non-TET………$1.160730 Cents per gallon 
Spot Ethanol prices have been trading quietly just above support, which ranges down to $1.50. The trend here is lower, but this market sees figures at or around $1.50 or $1.60 as representing value – especially in light of gasoline prices well above them. |