Prices for March 26th, 2010
| HEATING OIL cents per gallon | | MONTH | HIGH | LOW | SETTLE | CHANGE | | APR | 209.40 | 204.95 | 206.97 | up 00.04 | | MAY | 210.72 | 206.07 | 208.13 | dn 00.11 | | JUN | 212.07 | 207.44 | 209.39 | dn 00.31 | | JUL | 213.91 | 209.38 | 210.98 | dn 00.48 | | AUG | 214.68 | 211.25 | 212.58 | dn 00.65 | | SEP | 216.36 | 213.20 | 214.43 | dn 00.66 | | OCT | 216.59 | 216.20 | 216.36 | dn 00.79 | | NOV | 220.54 | 217.25 | 218.44 | dn 00.94 | | DEC | 223.91 | 219.11 | 220.57 | dn 01.08 | | JAN | 224.90 | 222.03 | 222.62 | dn 01.18 | | FEB | 223.95 | 222.95 | 223.67 | dn 01.25 | | MAR | 226.32 | 223.00 | 223.72 | dn 01.33 | | Estimated Volume (day before) total all prev day 108,364 | | NYMEX CRUDE OIL dollars per barrel | | MONTH | HIGH | LOW | SETTLE | CHANGE | | MAY | 81.46 | 79.54 | 80.00 | dn 00.53 | | JUN | 81.90 | 80.03 | 80.47 | dn 00.52 | | JUL | 82.34 | 80.50 | 80.96 | dn 00.50 | | AUG | 82.54 | 81.00 | 81.33 | dn 00.50 | | SEP | 82.84 | 81.32 | 81.60 | dn 00.51 | | OCT | 81.85 | 81.52 | 81.81 | dn 00.53 | | | | | | | | | Estimated Volume… 528,425 Opec Basket…$77.03 up $0.13
Prompt #2 Oil NYH 88..-0.75 to -0.50, 74 Lo S…+3.50 to +4.00
US Gulf 88 grade…-4.25 to -3.50, 74 grade Lo S…+2.00 to +2.25 Group .........+6.00 to +6.50 Lo S.....+6.00 to +6.50
Chicago ......-0.75 to +0.25 cash quotes by Dow Jones | | | |
| NYMEX RBOB GASOLINE cents per gallon | | MONTH | HIGH | LOW | SETTLE | CHANGE | | APR | 223.73 | 218.95 | 220.74 | dn 01.03 | | MAY | 223.98 | 219.08 | 220.85 | dn 01.14 | | JUN | 223.33 | 218.99 | 220.43 | dn 01.14 | | JUL | 221.85 | 218.20 | 219.75 | up 01.08 | | AUG | 220.87 | 218.01 | 218.85 | up 01.17 | | SEP | 218.91 | 216.67 | 217.60 | dn 01.29 | | OCT | 207.20 | 206.04 | 206.77 | dn 01.40 | | NOV | 206.64 | 204.33 | 205.09 | dn 01.38 | | Estimated RB Volume day before 108,520 | | NYMEX NATURAL GAS dollars per mmBtu | | MONTH | HIGH | LOW | SETTLE | CHANGE | | APR | 3.997 | 3.856 | 3.872 | dn 0.109 | | MAY | 4.046 | 3.923 | 3.930 | dn 0.099 | | JUN | 4.115 | 4.001 | 4.007 | dn 0.095 | | JUL | 4.199 | 4.098 | 4.104 | dn 0.092 | | | Estimated Volume…day before (257,648)
Nymex statistics are based on composite Access & Day Sessions
Prompt Gasoline NYH M5 -13.25 to -13.00 RBOB +9.75 /+10.25
US Gulf M4: -13.00 to -12.50 RBOB -3.50 to -3.00
L.A. Conv Reg 220.00-221.00, N-grade Group 210.75-211.25 Chi 212.60-213.10 | |
Market Review for Friday & the Weekend
N trading Thursday night into Friday morning, oil prices posted decent gains, based on a resurgent euro (and corresponding weaker dollar). When the Nymex opened, the DJIA was up roughly 50 points, gold was higher, the euro was higher and oil opened and traded higher. The EU had removed a barrier (it had previously insisted on more than Greek bonds as collateral) on Thursday, then backed away from helping Greece, and then hammered out an IMF/EU solution Friday morning. That was the main factor behind the euro’s resurgence as we ended the week.
On Friday, the Commerce Department reported that 4th Quarter GDP had gown at a rate of 5.6%, revised down from an initially released rate of 5.9%. Expectations had been for a revision to 5.8%, so Friday’s revision was disappointing for the economic recovery. Also out Friday, the University of Michigan/Reuters figures on consumer confidence were better than expected, coming in at 73.6, rather than just the 73.0 which had been predicted. The ‘normal’ extraneous factors were bullish.
| Fuel for Thought Three weeks ago, oil prices had eyes for only equities, and they rose on strength in the DJIA, powered by fresh fund buying, with contracts being added to the open interest. By Wednesday, March 17th, oil investors had incorporated weaker dollar levels into their buying schemata. By Thursday, March 18th, crude oil open interest had increased by 129,459 contracts in March alone. At its highest, crude had gained more than $4.00, largely on fresh fund buying. By this past Friday, less than 13,000 of those new contracts remained, and funds were ignoring better consumer confidence, a weaker dollar, higher gold and better stock quotes. And oil traders were back, selling against higher crude stocks and high gasoline output figures. |
These factors helped equities in early trading, and higher equities and a higher euro helped push oil prices higher at first. But, the gains could not be held across the board. The euro kept its gains, but the DJIA came back towards unchanged while oil prices turned unexpectedly weaker, falling to unchanged and then plowing new negative territory to finish on the day’s lows.
This weakness was especially disappointing, given good consumer sentiment and the much stronger euro through the Nymex close. The final headlines said that oil prices had reacted poorly to the revision in GDP, although meshing the timelines precisely is a bit frustrating.
At the end of the previous week (on Thursday, March 18th), crude oil open interest had been up 129,459 contracts since the start of March. Heating oil open interest had been up 32,788 and gasoline had gained 61,168 contracts. A week later, on March 25th, crude open interest was up 12,756 contracts in March, heating oil had gained 25,751 and gasoline had the best net gains, still, at 62,421. Crude oil has seen a massive liquidation of long contracts held by funds, it appears. On Friday, the funds were not buying oil on a weak dollar.
Technicals
Crude Oil:
Oil prices were lower again, yesterday, but they all remained inside their trading ranges. They are nearer now to their lower parameter, in a range between Monday’s low of $78.57 and the major resistance at $83.18.
Dollars per barrel
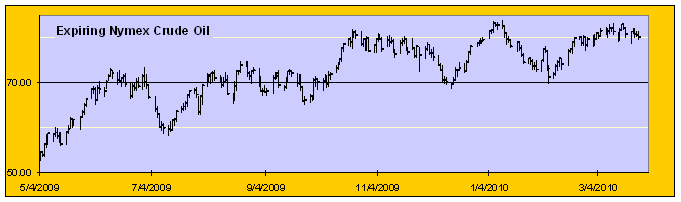
Crude oil is in a range between $78.57 and $83.18.
May crude oil now has buy-stops over $81.65, $82.50, $83.18, $83.95, $84.83, $85.13, $89.82, $90.99, $93.02, $96.03, and $100.37. Sell-stops are under $79.40, $78.85, $78.00, $77.00, $76.30, $73.70, $72.60, $71.30, $70.75, $69.30, $68.55, $68.00, $65.80-$66.20, and $64.95.
Football: The bears gained five yards on Friday on first down, and that makes it second and five to go today, for the bears.
May crude oil Support: $79.85-$80.00, $79.40-$79.55, $78.85-$79.00, $78.00-$78.10, $77.00-$77.20.
Resistance: $81.45-$81.65, $82.35-$82.50, $83.00-$83.18, $83.85-$83.95, $84.75-$84.85.
Heating Oil:
Heating oil prices were mixed on Friday, and they are still in a range between 202.50 and 214.42.
April heating oil has buy-stops over 209.75, 210.46, 211.60, 214.42, 217.55, 222.72, 225.80, 227.05, 229.08, 238.95, 249.62, and 251.50. Sell stops are under 204.95, 202.50, 201.55, 200.55, 199.00, 196.40, 190.75, 189.95, 187.45, 186.50, 182.63, 177.00, 176.68, and 173.75.
Apr heating oil Support: 204.95-205.10, 205.00-205.15, 204.50-204.65, 202.50-202.65, 201.55-201.70.
Resistance: 209.60-209.75, 210.35-210.46, 211.45-211.60, 214.30-214.42, 217.45-217.55.
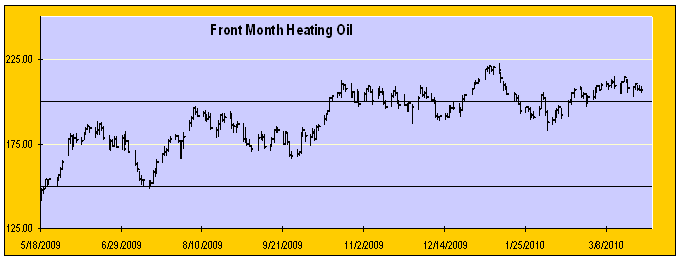
Heating oil prices were mixed to lower on Friday, and they are still in a trading range between 202.53 and 214.42. The direction prices break out next should determine the next direction taken by this market. Risk appetite can come and go in this market.
Gasoline:
Gasoline prices sold off on Friday, and they are still in a range between 218.95 and 231.50. They broke under 220.00, but did not settle beneath that. If prices finish under 220.00 – ideally, now below 218.95, the downside break will be confirmed.
April RBOB has buy-stops over 223.75, 225.50, 226.65, 230.40, 231.50, 240.10, 250.40, 252.00, 265.10, 267.85, and 270.85. Sell-stops are under 218.95, 215.50, 213.70, 203.80, 202.25, 198.40, 191.85, 187.00, 184.15, 182.40, 181.20, 179.20, 177.30, and 175.14.
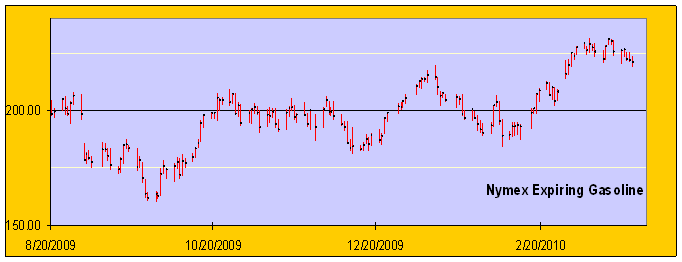
Gasoline prices broke down below 220.00, but they could not settle below that. Prices are in an expanded range between 218.95 and 231.50. For a confirmed breakdown we need to see a settle under 220.00, and ideally that would be accompanied by a break beneath 218.95. If prices rally, and we get a settle over 231.34 it would give us swing objectives to 249.35 and potentially as high as 267.41. Prices already had swing objectives to 242.28 and potentially as high as 289.89. Those are now in doubt.
Apr Rbob Support: 220.00-220.15, 218.95-219.15, 215.50-215.65, 213.70-213.85, 203.80-204.00.
Resistance: 223.60-223.75, 225.35-225.50, 226.50-226.65, 230.25-230.40, 231.35-231.50.
Oil Inventory Reports
Over the last eight years, gasoline stocks have been both higher and lower, four years for both. The average is a draw of slightly less than 900,000 bbls. Another factor that could have a bearing on this week’s statistics is the history of crude oil import increases. Four of the last six years have had an increase in imports, with the average increase over those four years coming in at 572,000 bpd. We had a large increase last week, which might mean it won’t occur this week. The average crude oil build for this time of year is more than 5 million barrels.
DOE History: Distillate stocks have fallen in six of the last eight years, by an average of 1.738 mln bbls. The eight-year average is a draw of 1.276 mln bbls (last week’s average draw was 1.266 mln bbls). Gasoline stocks fell in four of the last eight years, for a four-year average draw of 4.200 mln bbls. The eight-year average was a draw of 0.897 mln bbls. Crude oil stocks have been higher in all of the last eight years for an eight-year average build of 5.080 mln bbls. Utilization has been higher in four of the last eight years and has an eight-year average increase of 0.024%, with an eight-year average utilization figure of 87.28%. The four-year, pre-hurricane utilization average was 90.30%. Since Katrina, refineries have run at an average utilization rate of 84.25%. Crude oil imports have been higher in four of the last six years, and the average crude oil import figure over the last six years has increased 381,000 bpd. The average crude oil import figure over the last six years has been 10.113 million bpd. Imports were 0.716 mln bpd below that figure in last week’s report.
Last Week’s Inventory Comparison: Distillate stocks are now 1.0 million bbls, or 0.69%, higher than a year ago. Heating oil inventories are 4.0 mln bbls, or 10.90%, higher than they were a year ago. Gasoline stocks are 8.4 mln bbls (up 3.89%) higher against a year ago. Crude oil stocks are now 10.0 million bbls, or 2.77%, lower than a year ago. Residual stocks are 0.9 mln bbls (2.30%) lower than a year ago, jet fuel stocks are 1.1 mln bbls, (2.61%) higher than a year ago. Utilization is 0.90% lower than a year ago and 6.14% below the eight-year average. It is 8.83% lower than the four-year, pre-Katrina average and 3.45% below the average of the four years since the big hurricanes (Katrina & Rita) in 2005.
Last Week’s Demand: Four-week, total refined products demand came in at 19.360 million bpd, up 0.013 mln bbls on the week, and up 0.676 mln bpd and 3.61% against a year ago, reportedly. Six weeks ago, it was 0.159 mln bpd and 0.83% lower than a year ago. Four-week gasoline demand is at 8.953 mln bpd, up 1.19%, compared to down 1.26% five weeks ago. It was up 6,000 bpd on the week. Four-week distillate demand is now at 3.761 mln bpd, down 0.95%, compared to down 9.08% seven weeks ago. Four-week jet demand is now at 1.289 mln bpd, down 6.59% against a year ago, compared to up 8.17% 11 weeks ago. Four-week residual fuel demand is at 0.643 mln bpd, up 6.41%, compared to up 25.96% two weeks ago. Propane use is up 6.40%, to 1.405 mln bpd, compared to 1.330 mln bpd (up 7.34%) a week ago. The major figures were similar to slightly stronger than they were a week ago.
Last Week’s API Report: This week’s API report showed a huge build of 7.514 mln bbls in crude oil stocks, a draw of 2.534 mln bbls in distillate stocks and a small draw of only 0.081 mln bbls in gasoline inventories. Utilization was down 0.5% to 80.8%. Implied demand came in at a respectable 9.565 mln bpd in gasoline (after two strong weeks) and at 4.295 mln bpd in distillate. Crude oil imports were up an eye-catching 1.272 mln bpd to 9.189 mln bpd. Crude imports accounted for the build.
DOE Weekly Inventory Statistics
| Category | Final DOE Estimate
This Week’s Estimate | History
Last Year’s Report | Most Recent Changes
Last Week’s DOE Report | Versus A Year Ago
Millions of Barrels |
| Distillate | dn 1.00 to 1.50 mln bbls | up 0.221 | dn 2.422 mln bbls | up 1.000 |
| Gasoline | dn 2.75 to 3.25 | up 2.225 | dn 2.715 | up 8.400 |
| Crude oil | up 4.00 to 5.00 | up 2.844 | up 7.245 | dn 10.000 |
| Utilization | up 0.0% to 0.3% | dn 0.3% at 81.7% | up 0.50% at 81.10% | |
| Crude Imports | up 0.000 to 0.500 mmbd | up 0.170 to 9.554 | up 0.969 to 9.397 mln bpd | |
| DOE Distillate Demand | 3.809 mln bpd | up 047,000 | Gasoline Demand | 9.087 mln bpd | up 238,000 |
| DOE Distillate Production | 3.700 mln bpd | dn 091,000 | Gasoline Production | 9.024 mln bpd | up 063,000 |
| DOE Distillate Imports | 0.168 mln bpd | up 005,000 | Gasoline Imports | 0.623 mln bpd | up 015,000 |
Source: US Department of Energy’s Energy Information Administration
Open Interest Analysis
Crude oil open interest fell by 7,215 contracts on Thursday, when prices dropped. That looks like more long liquidation, which would be supportive. Open interest is up 12,756 for the month of March, so far. A week earlier, it had been up 129,459.
Heating oil open interest fell by 4,060 contracts on Thursday, when prices were lower. That looks like net, long liquidation, which would be supportive. Open interest has increased by 25,751 contracts since March 1st.
RBOB open interest grew by 969 contracts on Thursday, when prices were lower, which looks like net new selling, which would be bearish. Open interest is up 62,421 contracts since March 1st – which is the biggest net gain in the group.
Natural gas open interest grew by 10,707 on Thursday, when prices were lower. That looks like heavy, new selling, which tells us the funds were back in there pushing prices to their new lows on Thursday.
Thursday’s Open Interest Changes:
Crude 1,284,017 dn 7,215 Heat 322,398 dn 4,060 RBOB 324,188 up 969 Nat gas 837,152 up 10,707
CFTC Commitments of Traders for Nymex (Forensic analysis for the period ended Tuesday, March 23rd)
Crude oil prices dropped $0.06/bbl over the latest reporting period, and the best selling came from Managed Money long liquidation. These accounts – funds – liquidated 11,042 longs and added 1,802 new shorts. Producers also liquidated heavily, more than funds, but not on a net basis. Producers kicked out 33,031 existing longs, but they also covered 31,640 existing shorts. Swap Dealers were buying into the weakness, adding 11,410 new longs against just 199 new shorts. Other Reportables, which include commission houses, liquidated 283 existing longs and covered 903 existing shorts. Fund liquidation ‘allowed’ prices to decline (they were heavy buyers for weeks) and Producer liquidation was also a major factor pushing prices lower.
In heating oil futures, prices lost 1.25 cents a gallon, and the best net selling came from Managed Money accounts, which liquidated 4,074 existing longs and covered 2,687 shorts. Other Reportables added 36 new longs and added 1,398 new shorts. Producers added 1,468 longs and covered 1,462 existing shorts. And Swap Dealers added 566 new longs and 198 new shorts. Here, as well, managed money or fund liquidation helped push quotes lower – after powering them higher for weeks.
Gasoline prices fell 1.22 cents a gallon during the period under review. Managed Money accounts liquidated 2,850 existing longs and added 1,384 new shorts. The others, which had been sellers, were buying. Producers added 11,054 longs and 8,782 shorts. Swap Dealers added 755 longs and covered 215 shorts. Other Reportables added 1,781 longs and covered 153 shorts.
In natural gas, prices dropped 21.7 cents during the period under review. Managed Money accounts added 4,025 new longs against the sale of 2,467 new shorts. Other Reportables added 6,198 longs and 6,746 shorts. Producers added 2,768 longs and 355 shorts. Swap Dealers liquidated 2,643 longs and sold 356 new shorts. Swap Dealers were the best net sellers, after weeks of fund selling against everyone else’s buying. Commission houses were the best gross sellers, although they bought nearly as much. Only Swap Dealers are net long here (24 longs per short) with funds holding three shorts for each long.
Natural Gas & Utility Generation
Natural gas prices were lower again on Friday as traders responded to the latest Baker-Hughes report on drilling activity. The report showed an increase of just two rigs, but at 941 active rigs, the pressure has been building for a while. Even though gas prices have been in almost freefall, drilling activity continues to increase. It may be this factor that has been behind the heavy selling in this market by investment banks. They may have had solid advance knowledge that producers would continue to increase the number of active rigs in service. After all the technical damage done last week with the break below $4.00, and last week’s disappointing EIA report, and continuing forecasts for warmer weather, the rig count seems to have been the straw that broke the camel’s back. Prices dropped almost 11 cents per million bpd on Friday.
The latest CFTC Commitments of Traders Report shows a decline of almost 22 cents (for the ‘week’ from Tuesday to Tuesday March 16th to March 23rd) propelled by commission house and fund selling. Swap Dealers were liquidating existing longs and Producers were buying, which is what they have been doing over the last few weeks – despite a net short interest. The funds were not the biggest sellers over the period, breaking at least a three-week run. We had noted that three of the days in the period had crude prices moving in the opposite direction of gas prices, and we had wondered if we would see signs of spread unwinding in this report. We could not find exactly what we had expected, but we did notice that funds were liquidating long crude oil positions heavily, and that they stopped selling natural gas contracts as aggressively as they had over the previous three reports. They were still selling gas, and producers were still buying, and in the latest report commission houses were the biggest, gross, sellers. Swap dealers, which had been buying, seem to have thrown the towel in on this latest decline.
Last week’s break below $4.00 was confirmed by Friday’s continuing weakness. While we continue to wonder why the bullish factors in this market have not been given their due, at all, really, it now seems that the combination of heavy, dedicated fund selling, weak technical conditions which are bringing in commission house selling, warmer temperatures and probable stock gains, and even higher rig counts are tearing this market apart.
In cash trading on Friday, Henry Hub prices were at $3.86-$4.03, down $0.00-$0.07 on the day (DJN). SoCal prices were at $3.85-$4.01, down $0.15-$0.15 on the day. El Paso Permian prices were up $0.01 and down $0.15 at $3.76-$3.82. Katy prices were down $0.05-$0.06 to $3.84-$3.95. Waha prices were down $0.04-$0.12 at $3.76-$3.84. Transco 6 was down $0.13-$0.17 to $4.27-$4.40/mmBtu, according to Dow Jones News (DJN).
Palo Verde prices were last quoted at $37.25-$39.25/mwh. Northeastern prices last traded at $40.00-$43.50. Cinergy was last at $34.40-$35.00. Ercot was last at $36.00-$37.00/mwh.
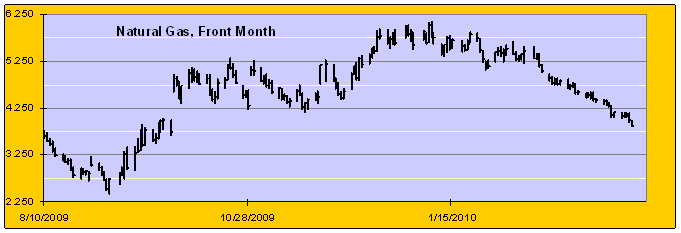
Support is at $3.85-$3.86, $3.73-$3.75, $3.66-$3.68, $3.50-$3.53, $3.44-$3.46, $3.28-$3.32, $2.91-$2.93, $2.80-$2.82, $2.74-$2.75, and $2.69-$2.70. Resistance is at $4.14-$4.18, $4.29-$4.30, $4.36-$4.37, $4.44-$4.47, $4.59-$4.63, $4.76-$4.79, $4.86-$4.89, $4.97-$5.00, $5.16-$5.17, $5.46-$5.47, $5.55-$5.60, $5.87-$5.90, $5.99-$6.03, $6.09-$6.11, $6.15-$6.17, $6.34-$6.37, $6.65-$6.69, $6.90-$6.94, $7.01-$7.04, $7.28-$7.31, and $7.34-$7.36. The April contract expires today.
Apr Natural Gas: Support : $3.85-$3.86, $3.73-$3.75, $3.66-$3.68, $3.50-$3.53, $3.44-$3.46, $3.28-$3.32.
Resistance: $4.14-$4.18, $4.36-$4.37, $4.44-$4.47, $4.59-$4.63, $4.76-$4.79, $4.86-$4.89.
Natural gas prices continued falling yesterday, and they are now at their lowest levels since 9-28-09.
Dollars per million Btu
The crude to gas ratio ended at 20.66 to one yesterday. It was its highest ratio since September 17th, when it reached 20.96-to-one.
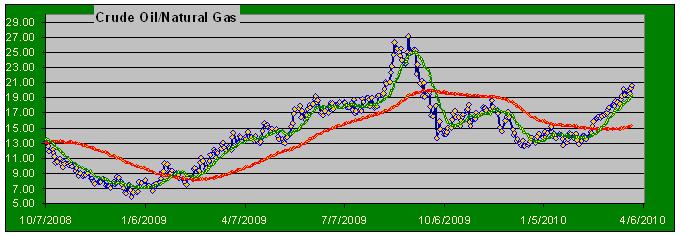
Ratio
EIA Weekly Storage Figures
Last week’s EIA report showed a build of 11 bcf on expectations for a build of 9-11 bcf. Stocks are now 28 bcf lower than a year ago, against a deficit of 40 bcf a week ago, a deficit of 71 bcf two weeks ago and a deficit of 71 bcf three weeks ago. Stocks are now 1.69% lower than a year ago. They are 121 bcf and 8.04% above the five-year average.
For this week, the eight-year average (of similar Friday reports) was a draw of 10.00 bcf. The five-year average was a draw of 6.4 bcf. Last year’s storage number was unchanged. Over the last eight years, five years showed draws, two years showed builds, and last year showed no change.
EIA Report
| Region | 03-19-10 | 03-12-10 | Change | Last Year | 5 Yr Avg |
| Cons East | 760 | 770 | dn 10 | 666 | 696 |
| Cons West | 285 | 283 | up 02 | 280 | 228 |
| Producing | 581 | 562 | up 19 | 707 | 581 |
| Total US | 1626 | 1615 | up 11 | 1654 | 1505 |
Bcf, or Billions of cubic feet. Source: Energy Information Administration, US Department of Energy
News & Views
We are in the middle of giving this report another in its long line of “face-lifts,” which will continue over the next week or so. We have tried to place all the related information in one location and have moved the daily charts we had spread throughout the report into one larger technical section. We apologize if this causes any confusion this week, but we hope that it will make more sense over the longer-term, and will allow readers to find topics of interest in more contiguous reading zones.
We have developed a closer working relationship with FMXConnect, which will allow our readers access to options and cash information, almost all of which will be free to subscribers of this report. This relationship will be deepening in the months ahead, and will allow clients to get our report online, whenever it suits them, in addition to getting it by email, which will not change. These changes are designed for those of our readers who travel or rely on hand-held devices, which are too numerous for us to itemize. We want to make it easier for those readers to get our information “on the go,” as it were. And, with many of our readers using options, we realized that we needed a synergistic relationship with someone who understands and can provide information on options, which is where FMXConnect comes in. For those who do none of these, nothing will change – except the facelifts and minor reorganizations which can be seen in this report. We will have more information available on the options access, but anyone who wants a username and password to see this report online can get it now. Just email us the names and email addresses and we will get usernames and passwords to you very quickly.
In trading on Globex last night, May crude oil prices were up $0.47 to $80.47, at 11:30 PM EDT. April heating oil prices were up 1.25 cents to 2.0822/gallon. Gasoline prices were up 0.95 cents to 2.2169/gallon. April natural gas, which expires this afternoon, was down 0.007 to $3.865/mmBtu.
Especially in crude oil, it seemed on Friday that the trading funds had lost their interest in the market. We do not know if they had liquidated their positions ahead of Passover and Easter, but the timing would be right. Despite plenty of potential cues from the dollar and equities, investors stayed on the sidelines. That allowed oil traders to use fundamentals to decide Friday’s trading movement and activity. While we found it refreshing and welcome, it was nonetheless surprising
An Illustrated Look at Energy Market Factors
A Look at the US Dollar Versus the Euro
 Dollar-Euro (dollar in euro cents): Three-Month Bar-Chart
 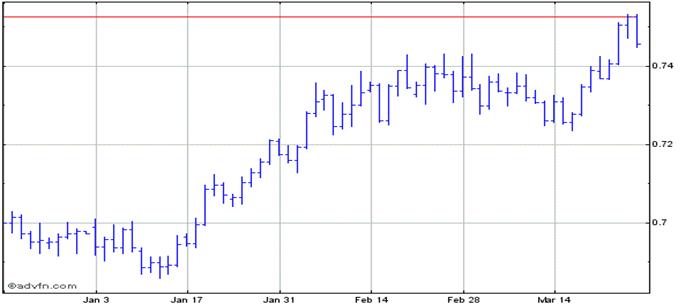 The US dollar started to drop in trading overnight on Thursday into Friday morning, and it kept falling through the day and into the end of the week. After a series of steps and mis-steps, the European Central Bank (ECB) finally fell into line with European leaders who ended up spending more time on the Greek debt issue than Germany would have liked. The EU and IMF are supposed to find a joint solution to the problem.
http://www.x-rates.com/d/EUR/USD/graph120.html
A Look at the Dow Jones Industrial Average (djia)
Dow Jones Industrial Average: One-Year Chart
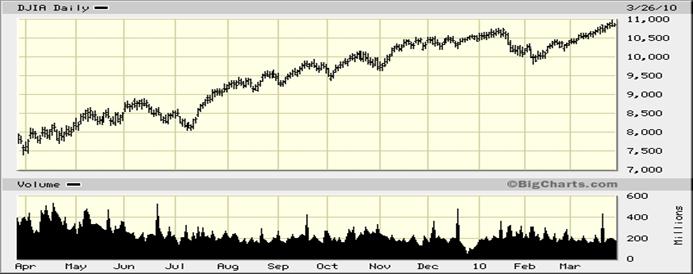
The DJIA ended with a gain of 9.15 points on Friday, but it had been up significantly more than that earlier in the day. Investors were reacting to an apparent solution to the Greek debt problem and to a disappointing revision in US 4Q GDP.
Source: http://bigcharts.marketwatch.com/quickchart/quickchart.asp?symb=DJIA&sid=1643
Recommendations for Specific Market Segments
Heating Oil Distributors Heating oil prices were mixed on Friday, although they remain in a trading range between 202.50 and 214.42. As we have noted, this market needs to break and settle over 214.42 for prices to launch any upside move from here. The inverse of that would suggest that we need to see a decisive settlement below 202.50 to drop substantially. We are not sure where we are in terms of the bigger picture, but it seems that trading funds got in early on the long side – anticipating the seasonal. When the dollar strengthened, though, they started getting out of those long positions and, by Friday, it seemed that the funds had gotten out ahead of the holidays. We would hold what we have here, but we are not keen to add to the long side until we see some sign that prices have found support. Diesel Users We would hold our caps here. We want to watch before adding. NYH Ultra Low Sulfur Diesel.…213.45-213.95 plus 6.750 USG Ultra Low Sulfur Diesel.…211.65-211.90 plus 3.625 Jet/Kerosene Users & Airlines New York Harbor cash market differentials were 7.25 to 7.50 cents over January heating oil in NY Harbor and 2.00 to 2.25 over the screen in the US Gulf. Diesel & Gasoline Marketers We would stay hedged here as we start the week. Gasoline Blenders & End-Users Prices have broken to the upside, and we want to hold our positions. Prompt NYH Fuel Ethanol…..164.00-166.00 Prompt USG Fuel Ethanol….157.00-159.00 Quotes from 03-26-10 Heating Oil End-Users We want to hold what we have here, but we are not adding today. Speculators We bought calls through March 15th. We would hold them here. Refiners The 7:5+2 crack spread was $11.06 on Friday. This time of year is when crack spreads typically strengthen. Crude Oil Producers Crude oil prices are in a range between $78.57 and $83.18. Prices need to break one way or another to generate another trend. | Prompt Jet Fuel Prices New York Harbor 214.20-214.45 US Gulf 210.15-210.40 Midwest (Group Three) 210.95-211.95 Midwest (Chicago) 211.55-212.05 Los Angeles 214.00-215.00 San Francisco 214.00-215.00 Portland, Oregon 214.00-215.00 Cents per gallon Propane Prices Mont Belvieu……….…..non-TET………$1.090000 Cents per gallon 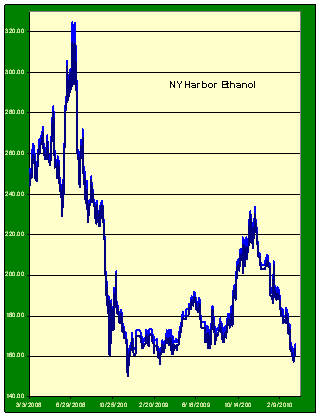
Spot Ethanol prices have fallen dramatically, along with corn prices, in recent weeks. |