Prices for March 29th, 2010
| HEATING OIL cents per gallon | | MONTH | HIGH | LOW | SETTLE | CHANGE | | APR | 214.29 | 207.65 | 211.88 | up 04.91 | | MAY | 215.32 | 208.30 | 212.86 | up 04.73 | | JUN | 216.41 | 210.36 | 214.08 | up 04.69 | | JUL | 217.28 | 211.85 | 215.72 | up 04.74 | | AUG | 218.91 | 213.92 | 217.36 | up 04.78 | | SEP | 221.08 | 216.70 | 219.26 | up 04.83 | | OCT | 221.87 | 218.05 | 221.18 | up 04.82 | | NOV | 223.88 | 219.57 | 223.23 | up 04.79 | | DEC | 227.10 | 221.63 | 225.31 | up 04.74 | | JAN | 227.84 | 224.79 | 227.31 | up 04.69 | | FEB | 229.20 | 225.80 | 228.31 | up 04.64 | | MAR | 228.83 | 225.92 | 228.36 | up 04.64 | | Estimated Volume (day before) total all prev day 127,620 | | NYMEX CRUDE OIL dollars per barrel | | MONTH | HIGH | LOW | SETTLE | CHANGE | | MAY | 82.78 | 80.18 | 82.17 | up 02.17 | | JUN | 83.18 | 80.71 | 82.59 | up 02.12 | | JUL | 83.59 | 81.20 | 83.02 | up 02.06 | | AUG | 83.89 | 81.72 | 83.32 | up 01.99 | | SEP | 84.12 | 81.89 | 83.53 | up 01.93 | | OCT | 84.35 | 82.24 | 83.70 | up 01.89 | | | | | | | | | Estimated Volume… 503,685 Opec Basket…$76.80 dn $0.23
Prompt #2 Oil NYH 88..-0.50 to -0.25, 74 Lo S…+4.00 to +4.50
US Gulf 88 grade…-4.25 to -4.00, 74 grade Lo S…+2.00 to +2.50 Group .........+6.00 to +6.50 Lo S.....+6.00 to +6.50
Chicago ......-0.75 to +0.25 cash quotes by Dow Jones | | | |
| NYMEX RBOB GASOLINE cents per gallon | | MONTH | HIGH | LOW | SETTLE | CHANGE | | APR | 227.51 | 221.40 | 226.13 | up 05.39 | | MAY | 227.75 | 221.34 | 226.27 | up 05.42 | | JUN | 227.12 | 221.14 | 225.87 | up 05.44 | | JUL | 226.41 | 221.67 | 225.16 | up 05.41 | | AUG | 225.32 | 221.48 | 224.22 | up 05.37 | | SEP | 224.37 | 219.05 | 222.94 | up 05.34 | | OCT | 213.33 | 207.88 | 212.05 | up 05.28 | | NOV | 210.57 | 210.20 | 210.41 | up 05.12 | | Estimated RB Volume day before 103,848 | | NYMEX NATURAL GAS dollars per mmBtu | | MONTH | HIGH | LOW | SETTLE | CHANGE | | APR | 3.950 | 3.820 | 3.842 | dn 0.030 | | MAY | 4.024 | 3.883 | 3.916 | dn 0.014 | | JUN | 4.104 | 3.972 | 4.001 | dn 0.006 | | JUL | 4.202 | 4.076 | 4.101 | dn 0.003 | | | Estimated Volume…day before (199,591)
Nymex statistics are based on composite Access & Day Sessions
Prompt Gasoline NYH M5 -14.50 to -13.00 RBOB +5.00 /+7.00
US Gulf M4: -12.50 to -12.00 RBOB -3.50 to -3.00
L.A. Conv Reg 220.00-221.00, N-grade Group 210.75-211.25 Chi 212.60-213.10 | |
Market Review for Monday
S it turns out, Friday’s return to the oil market fundamentals was not the start of any new trend, nor was it, as we thought on Friday, a retreat by the bulls ahead of this abbreviated holiday week (Passover & Good Friday, then Easter). Most markets will be closed for Good Friday, and it looked to us, based on the severe reduction in open interest, that the investment funds may have gotten out of their long holdings and moved off to the sidelines for a week. It does not look that way tonight (last night). They seem to have returned yesterday (to the buy side).
Crude oil prices printed their highest prices in seven trading days, and a lower dollar and stronger stock market were important factors in yesterday’s advance. That tells us that investors have not – even temporarily – lost their interest in the long side, here. And, it once again seems that oil market fundamentals have taken a back seat to the trump suits of equities and currencies. Investors buying oil yesterday were talking about an increase in confidence that the US recovery is gaining steam.
| Fuel for Thought Earlier this month, Saudi Arabian Oil Minister Ali Naimi told reporters that he was happy with oil prices, which he suggested had hit that perfect “stability” that had been the Holy Grail for Opec for 30 years. Of course, their idea of perfect stability is a prolonged period of relatively high-priced oil – which only looks in any way “fair” in comparison to even higher levels, in this case $147 a barrel. Underlining this new comfort zone, Opec Secretary General Abdalla Salem El Badri said late yesterday that Opec will bring back on line an estimated $45 billion worth of drilling projects which had been placed on the back burner when prices were lower, and had not achieved this new “stability.” |
Dow Jones said, in its oil market roundup, that fresh steps have been taken to shore up the debt situation in Greece, and it pointed at “more upbeat economic data in Europe, Asia and the US” as guiding lights behind yesterday’s sharp turn higher. From our perspective, the markets just cannot put risk down on the mat; it keeps getting back up when we least expect it, flying in the face of traditional oil fundamentals or technicals.
Greece announced plans to raise €5 billion in bonds in order to meet its debt exposure. This represented the long-sought after concrete step by Greece to take responsibility for its own recovery. Last week, the EU and IMF pledged their support during the restructuring.
The European Commission also reported its Economic Sentiment Indicator up to 97.7 from 95.9 in February, Dow Jones reported yesterday. At the same time, personal spending in the US was reported up 0.3% in February.
The overall feeling yesterday was that the global economy is strengthening, the US is becoming an engine of (albeit modest) growth and the carry trade is alive and well and luring investors back to the long side of oil futures.
Technicals
Crude Oil:
Oil prices jumped higher yesterday, and it looks like the major support at $78.57 is going to hold, at least for this week. Prices remain in a range between $78.57 and the major resistance at $83.18.
Dollars per barrel
Crude oil is in a range between $78.57 and $83.18.
May crude oil now has buy-stops over $82.80, $83.18, $83.95, $84.83, $85.13, $89.82, $90.99, $93.02, $96.03, and $100.37. Sell-stops are under $80.00-$80.15, $79.40, $78.85, $78.00, $77.00, $76.30, $73.70, $72.60, $71.30, $70.75, $69.30, $68.55, $68.00, $65.80-$66.20, and $64.95.
Football: The bears lost 22 yards yesterday on second and five to go, making it third and 27 to go, today.
May crude oil Support: $79.85-$80.00, $79.40-$79.55, $78.85-$79.00, $78.00-$78.10, $77.00-$77.20.
Resistance: $82.35-$82.50, $82.75-$82.80, $83.00-$83.18, $83.85-$83.95, $84.75-$84.85.
Heating Oil:
Heating oil prices were higher yesterday, and they are still in a range between 202.50 and 214.42. All of a sudden, prices are back to threatening the upper end of their trading range at 214.42.
April heating oil has buy-stops over 214.42, 217.55, 222.72, 225.80, 227.05, 229.08, 238.95, 249.62, and 251.50. Sell stops are under 207.65, 204.95, 202.50, 201.55, 200.55, 199.00, 196.40, 190.75, 189.95, 187.45, 186.50, 182.63, 177.00, 176.68, and 173.75.
Apr heating oil Support: 207.65-207.80, 204.95-205.10, 205.00-205.15, 204.50-204.65, 202.50-202.65.
Resistance: 214.30-214.42, 217.45-217.55, 222.65-222.72, 225.65-225.80, 226.90-227.05.
Heating oil prices were higher yesterday, and quite suddenly they are back threatening the upper end of their trading range between 202.50 and 214.42. At the end of last week, we were looking at the possibility of breaking to the downside.
Gasoline:
Gasoline prices rallied yesterday, and it now looks like this market has widened its trading range to 218.95 and 231.50. At the end of last week, we were challenging the lower end; now the upper end is in the market’s sights.
April RBOB has buy-stops over 227.51, 230.40, 231.50, 240.10, 250.40, 252.00, 265.10, 267.85, and 270.85. Sell-stops are under 221.40, 218.95, 215.50, 213.70, 203.80, 202.25, 198.40, 191.85, 187.00, 184.15, 182.40, 181.20, 179.20, 177.30, and 175.14.
Gasoline prices rallied yesterday and, instead of breaking support on the downside, prices are now in an expanded range between 218.95 and 231.50. For a confirmed breakdown we need to see a settle under 220.00, and ideally that would be accompanied by a break beneath 218.95. After yesterday’s rally, it now looks like prices have just as good a chance of breaking over 231.50 – possibly a much better chance based on where prices are right now.
Apr Rbob Support: 221.40-221.55, 220.00-220.15, 218.95-219.15, 215.50-215.65, 213.70-213.85.
Resistance: 227.35-227.51, 230.25-230.40, 231.35-231.50, 239.85-240.10, 250.25-250.40.
Oil Inventory Reports
Over the last eight years, gasoline stocks have been both higher and lower, four years for both. The average is a draw of slightly less than 900,000 bbls. Another factor that could have a bearing on this week’s statistics is the history of crude oil import increases. Four of the last six years have had an increase in imports, with the average increase over those four years coming in at 572,000 bpd. We had a large increase last week, which might mean it won’t occur this week. The average crude oil build for this time of year is more than 5 million barrels.
DOE History: Distillate stocks have fallen in six of the last eight years, by an average of 1.738 mln bbls. The eight-year average is a draw of 1.276 mln bbls (last week’s average draw was 1.266 mln bbls). Gasoline stocks fell in four of the last eight years, for a four-year average draw of 4.200 mln bbls. The eight-year average was a draw of 0.897 mln bbls. Crude oil stocks have been higher in all of the last eight years for an eight-year average build of 5.080 mln bbls. Utilization has been higher in four of the last eight years and has an eight-year average increase of 0.024%, with an eight-year average utilization figure of 87.28%. The four-year, pre-hurricane utilization average was 90.30%. Since Katrina, refineries have run at an average utilization rate of 84.25%. Crude oil imports have been higher in four of the last six years, and the average crude oil import figure over the last six years has increased 381,000 bpd. The average crude oil import figure over the last six years has been 10.113 million bpd. Imports were 0.716 mln bpd below that figure in last week’s report.
Last Week’s Inventory Comparison: Distillate stocks are now 1.0 million bbls, or 0.69%, higher than a year ago. Heating oil inventories are 4.0 mln bbls, or 10.90%, higher than they were a year ago. Gasoline stocks are 8.4 mln bbls (up 3.89%) higher against a year ago. Crude oil stocks are now 10.0 million bbls, or 2.77%, lower than a year ago. Residual stocks are 0.9 mln bbls (2.30%) lower than a year ago, jet fuel stocks are 1.1 mln bbls, (2.61%) higher than a year ago. Utilization is 0.90% lower than a year ago and 6.14% below the eight-year average. It is 8.83% lower than the four-year, pre-Katrina average and 3.45% below the average of the four years since the big hurricanes (Katrina & Rita) in 2005.
Last Week’s Demand: Four-week, total refined products demand came in at 19.360 million bpd, up 0.013 mln bbls on the week, and up 0.676 mln bpd and 3.61% against a year ago, reportedly. Six weeks ago, it was 0.159 mln bpd and 0.83% lower than a year ago. Four-week gasoline demand is at 8.953 mln bpd, up 1.19%, compared to down 1.26% five weeks ago. It was up 6,000 bpd on the week. Four-week distillate demand is now at 3.761 mln bpd, down 0.95%, compared to down 9.08% seven weeks ago. Four-week jet demand is now at 1.289 mln bpd, down 6.59% against a year ago, compared to up 8.17% 11 weeks ago. Four-week residual fuel demand is at 0.643 mln bpd, up 6.41%, compared to up 25.96% two weeks ago. Propane use is up 6.40%, to 1.405 mln bpd, compared to 1.330 mln bpd (up 7.34%) a week ago. The major figures were similar to slightly stronger than they were a week ago.
Last Week’s API Report: This week’s API report showed a huge build of 7.514 mln bbls in crude oil stocks, a draw of 2.534 mln bbls in distillate stocks and a small draw of only 0.081 mln bbls in gasoline inventories. Utilization was down 0.5% to 80.8%. Implied demand came in at a respectable 9.565 mln bpd in gasoline (after two strong weeks) and at 4.295 mln bpd in distillate. Crude oil imports were up an eye-catching 1.272 mln bpd to 9.189 mln bpd. Crude imports accounted for the build.
DOE Weekly Inventory Statistics
| Category | Final DOE Estimate
This Week’s Estimate | History
Last Year’s Report | Most Recent Changes
Last Week’s DOE Report | Versus A Year Ago
Millions of Barrels |
| Distillate | dn 1.00 to 1.50 mln bbls | up 0.221 | dn 2.422 mln bbls | up 1.000 |
| Gasoline | dn 2.75 to 3.25 | up 2.225 | dn 2.715 | up 8.400 |
| Crude oil | up 4.00 to 5.00 | up 2.844 | up 7.245 | dn 10.000 |
| Utilization | up 0.0% to 0.3% | dn 0.3% at 81.7% | up 0.50% at 81.10% | |
| Crude Imports | up 0.000 to 0.500 mmbd | up 0.170 to 9.554 | up 0.969 to 9.397 mln bpd | |
| DOE Distillate Demand | 3.809 mln bpd | up 047,000 | Gasoline Demand | 9.087 mln bpd | up 238,000 |
| DOE Distillate Production | 3.700 mln bpd | dn 091,000 | Gasoline Production | 9.024 mln bpd | up 063,000 |
| DOE Distillate Imports | 0.168 mln bpd | up 005,000 | Gasoline Imports | 0.623 mln bpd | up 015,000 |
Source: US Department of Energy’s Energy Information Administration
Open Interest Analysis
Crude oil open interest grew by 5,224 contracts on Friday, when prices dropped. That looks like fresh selling, which would be bearish. Under the circumstances it looks like new producer selling. Since March 1, open interest is up 12,756.
Heating oil open interest fell by 2,175 contracts on Friday, when prices were mixed. That looks like net, long liquidation and short-covering. Open interest has increased by 23,576 contracts since March 1st.
RBOB open interest fell by 8,023 contracts on Friday, when prices were lower, which looks like net long liquidation. Open interest is up 54,398 contracts since March 1st – which is still the biggest net gain in the group.
Natural gas open interest fell by 20,382 on Friday, when prices were lower. That looks like heavy long liquidation, which would be supportive. Open interest for March is now up just 639 contracts.
Friday’s Open Interest Changes:
Crude 1,289,237 up 5,224 Heat 320,223 dn 2,175 RBOB 316,165 dn 8,023 Nat gas 816,770 dn 20,382
CFTC Commitments of Traders for Nymex (Forensic analysis for the period ended Tuesday, March 23rd)
Crude oil prices dropped $0.06/bbl over the latest reporting period, and the best selling came from Managed Money long liquidation. These accounts – funds – liquidated 11,042 longs and added 1,802 new shorts. Producers also liquidated heavily, more than funds, but not on a net basis. Producers kicked out 33,031 existing longs, but they also covered 31,640 existing shorts. Swap Dealers were buying into the weakness, adding 11,410 new longs against just 199 new shorts. Other Reportables, which include commission houses, liquidated 283 existing longs and covered 903 existing shorts. Fund liquidation ‘allowed’ prices to decline (they were heavy buyers for weeks) and Producer liquidation was also a major factor pushing prices lower.
In heating oil futures, prices lost 1.25 cents a gallon, and the best net selling came from Managed Money accounts, which liquidated 4,074 existing longs and covered 2,687 shorts. Other Reportables added 36 new longs and added 1,398 new shorts. Producers added 1,468 longs and covered 1,462 existing shorts. And Swap Dealers added 566 new longs and 198 new shorts. Here, as well, managed money or fund liquidation helped push quotes lower – after powering them higher for weeks.
Gasoline prices fell 1.22 cents a gallon during the period under review. Managed Money accounts liquidated 2,850 existing longs and added 1,384 new shorts. The others, which had been sellers, were buying. Producers added 11,054 longs and 8,782 shorts. Swap Dealers added 755 longs and covered 215 shorts. Other Reportables added 1,781 longs and covered 153 shorts.
In natural gas, prices dropped 21.7 cents during the period under review. Managed Money accounts added 4,025 new longs against the sale of 2,467 new shorts. Other Reportables added 6,198 longs and 6,746 shorts. Producers added 2,768 longs and 355 shorts. Swap Dealers liquidated 2,643 longs and sold 356 new shorts. Swap Dealers were the best net sellers, after weeks of fund selling against everyone else’s buying. Commission houses were the best gross sellers, although they bought nearly as much. Only Swap Dealers are net long here (24 longs per short) with funds holding three shorts for each long.
Natural Gas & Utility Generation
Natural gas prices dropped another three cents in a market that has been completely routed by the big bears. They continue to make headway on each new headline in this market, and traders are not being given even a few minutes to look at the bigger picture. We understand that growing rig counts could be bearish. But, there are considerations clearly not being taken into account. Rigs are not brought into service on Thursday afternoon after a quick breakfast meeting the preceding Monday. These decisions take time, and we do not know at what prices the latest additions were considered and ratified. Knowing that might give us a glimpse into the future. And, every coin has two sides, so while higher rig counts are bearish, the decision to put them into service would seem to be born of a longer-term bullishness. If producers did not expect gas prices to advance at some future stage to higher prices, they would not be increasing rig counts now.
The latest CFTC Commitments of Traders Report shows some interesting relationships. Producers are still net short, but only by 16,771 contracts, and the ratio of shorts to longs is now 1.19-to-one. Other Reportables are also net short, to the tune of 22,104 contracts, with a short-to long ratio of 1.73-to-one. It is the Managed Money category that is substantially short, holding 163,869 contracts net short, with a ratio of 3.09-to-one, short to long. Funds are holding more than 59% of the outstanding short commitments, according to the disaggregated numbers, which do not include unreportable positions (about half the open interest). Swap Dealers, by default, are holding the big, net long position, with 170,784 net long holdings. The ratio of longs to shorts is a staggering 23.81-to-one. It looks like smaller, unreportable positions are holding a large proportion of the total short interest. And industrial users are holding a large number of swap positions on the long side to lock in these low prices. That could be beneficial to company’s bottom lines if this market turns back up again, as it one day must.
As we end the month, we are seeing the normal book-squaring, cash-outs and pipeline balancing. None of this seems to be helping this market. April natural gas futures on the Nymex expired yesterday, but there was no discernible short-covering, and the combination of technical weakness, warmer weather forecasts (despite bitterly cold and wet conditions recently) and bearish storage forecasts are wearing on prices.
In cash trading yesterday, Henry Hub prices were at $3.80-$3.85, down $0.06-$0.18 on the day (DJN). SoCal prices were at $3.80-$3.94, down $0.05-$0.07 on the day. El Paso Permian prices were down $0.08-$0.12/mmBtu to $3.64-$3.74. Katy prices were down $0.09-$0.12 to $3.75-$3.83. Waha prices were down $0.06-$0.10 at $3.70-$3.74. Transco 6 was down $0.44-$0.51 to $3.83-$3.89/mmBtu, according to Dow Jones News (DJN).
Palo Verde prices were last quoted at $37.25-$39.00/mwh. Northeastern prices last traded at $38.50-$42.25. Cinergy was last at $33.00-$33.85. Ercot was last at $33.50-$34.50/mwh.
Support is at $3.82-$3.86, $3.73-$3.75, $3.66-$3.68, $3.50-$3.53, $3.44-$3.46, $3.28-$3.32, $2.91-$2.93, $2.80-$2.82, $2.74-$2.75, and $2.69-$2.70. Resistance is at $3.93-$3.95, $4.01-$4.02, $4.14-$4.18, $4.29-$4.30, $4.36-$4.37, $4.44-$4.47, $4.59-$4.63, $4.76-$4.79, $4.86-$4.89, $4.97-$5.00, $5.16-$5.17, $5.46-$5.47, $5.55-$5.60, $5.87-$5.90, $5.99-$6.03, $6.09-$6.11, $6.15-$6.17, $6.34-$6.37, $6.65-$6.69, $6.90-$6.94, $7.01-$7.04, $7.28-$7.31, and $7.34-$7.36.
May Natural Gas: Support : $3.82-$3.86, $3.73-$3.75, $3.66-$3.68, $3.50-$3.53, $3.44-$3.46, $3.28-$3.32.
Resistance: $3.93-$3.95, $4.01-$4.02, $4.14-$4.18, $4.36-$4.37, $4.44-$4.47, $4.59-$4.63.
Natural gas prices lost another three cents per million Btu yesterday. Prices are at their lowest levels since 9-28-09.
Dollars per million Btu
The crude to gas ratio ended at 21.39 to one yesterday. It was its highest ratio since September 11th, when it reached 23.41-to-one.
Ratio
EIA Weekly Storage Figures
Last week’s EIA report showed a build of 11 bcf on expectations for a build of 9-11 bcf. Stocks are now 28 bcf lower than a year ago, against a deficit of 40 bcf a week ago, a deficit of 71 bcf two weeks ago and a deficit of 71 bcf three weeks ago. Stocks are now 1.69% lower than a year ago. They are 121 bcf and 8.04% above the five-year average.
For this week, the eight-year average (of similar Friday reports) was a draw of 10.00 bcf. The five-year average was a draw of 6.4 bcf. Last year’s storage number was unchanged. Over the last eight years, five years showed draws, two years showed builds, and last year showed no change.
EIA Report
| Region | 03-19-10 | 03-12-10 | Change | Last Year | 5 Yr Avg |
| Cons East | 760 | 770 | dn 10 | 666 | 696 |
| Cons West | 285 | 283 | up 02 | 280 | 228 |
| Producing | 581 | 562 | up 19 | 707 | 581 |
| Total US | 1626 | 1615 | up 11 | 1654 | 1505 |
Bcf, or Billions of cubic feet. Source: Energy Information Administration, US Department of Energy
News & Views
 In trading on Globex last night, May crude oil prices were up $0.15 to $82.32, at 8:30 PM EDT. April heating oil prices were up 0.27 cents to 2.1215/gallon. Gasoline prices were up 0.34 cents to 2.2647/gallon. May natural gas, was down 0.030 to $3.880/mmBtu. A weaker US dollar and stronger equities led quotes higher in trading overnight.
BP’s Global Indicator Margin, a statistical method of looking at refinery margins, showed a margin of $2.95 per barrel in the first quarter, up from just $1.49 a barrel in the fourth quarter of 2009. It looks like an improvement; in fact, it is nearly double, but last year’s first quarter showed a netback of $6.20 a barrel. Northwest Europe, with a margin of $4.24 a barrel, up from $2.69 in the fourth quarter, had the most robust figures, according to Bloomberg. The US Gulf Coast had a margin of $3.38, up from $1.75/bbl. Asian refiners theoretically made just 96 cents a barrel in the first quarter. These figures, while not as good as a year ago, still suggest higher run rates to follow as we ramp up during the second quarter.
While managed money investor funds continue to hammer natural gas prices, one measure suggests that prices may be nearing a bottom. Exxon, which bought Mobil when crude was three weeks away from hitting a low of $10.35/bbl in 1998, has finalized its purchase of XTO Energy, a large player in natural gas production. Even Goldman Sachs is now saying that gas prices should be more than $6 per million Btu within the next 12 months.
An Illustrated Look at Energy Market Factors
A Look at the US Dollar Versus the Euro
 Dollar-Euro (dollar in euro cents): Three-Month Bar-Chart
 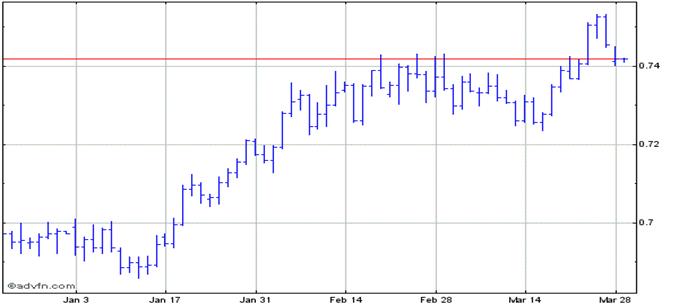 The US dollar sold off again yesterday, leaving us with a two-day breakout to the upside last week – which is no longer holding its ground. Technically, a two-day breakout is generally seen as being reliable. But, in the current topsy-turvy world of fake-outs and trader traps, one has to wonder where we are in terms of last week’s breakout. Yesterday’s weakness helped push oil prices higher.
http://www.x-rates.com/d/EUR/USD/graph120.html
A Look at the Dow Jones Industrial Average (djia)
Dow Jones Industrial Average: One-Year Chart
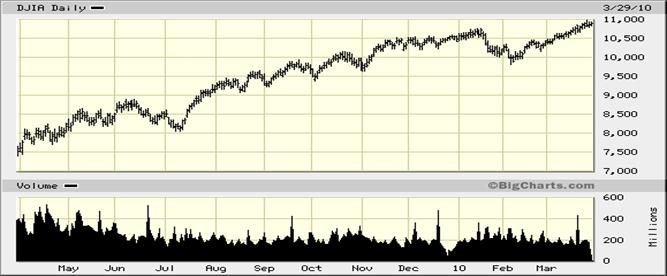
The DJIA ended with a gain of 45.50 points yesterday, and the DJIA has been loitering near and at new highs consistently lately. Yesterday’s strength helped oil prices gain ground yesterday. Volume was light, though … .
Source: http://bigcharts.marketwatch.com/quickchart/quickchart.asp?symb=DJIA&sid=1643
Recommendations for Specific Market Segments
Heating Oil Distributors Heating oil prices were higher yesterday, and now we wish we had been buying. Of course, on Friday, everything looked a good deal more unsettled. If we get a chance today, we would add to our upside protection, because it now seems that risk appetite is back, with a vengeance, and it seems that Friday’s fundamental reaction was just a one-time deal. That does not make us thrilled, but we just want to know by which rules this market is playing. Apparently, we are back to dollar weakness and equities strength as our trump cards. No matter how bad these look, we seem to be able to generate one-day turns like yesterday’s. We would hold what we have here, and we would add to existing long bias positions. Diesel Users We would hold our caps here., and would add to them. NYH Ultra Low Sulfur Diesel.…217.90-218.15 plus 6.125 USG Ultra Low Sulfur Diesel.…216.10-216.35 plus 3.375 Jet/Kerosene Users & Airlines New York Harbor cash market differentials were 6.25 to 7.00 cents over January heating oil in NY Harbor and 1.50 to 2.00 over the screen in the US Gulf. Diesel & Gasoline Marketers We would stay hedged here as we start the week. Gasoline Blenders & End-Users Prices look bullish again, so we would hold and add to long bias holdings. Prompt NYH Fuel Ethanol…..164.00-166.00 Prompt USG Fuel Ethanol….157.00-159.00 Quotes from 03-29-10 Heating Oil End-Users We want to hold what we have here, and we would add to them. Speculators We bought calls through March 15th. We would hold them and add to them here. Refiners The 7:5+2 crack spread was $11.09 yesterday. This time of year is when crack spreads typically strengthen. Crude Oil Producers Crude oil prices are in a range between $78.57 and $83.18. Prices are now – again – threatening to break to the upside. | Prompt Jet Fuel Prices New York Harbor 218.15-218.90 US Gulf 214.35-214.85 Midwest (Group Three) 210.95-211.95 Midwest (Chicago) 211.55-212.05 Los Angeles 219.00-220.00 San Francisco 219.00-220.00 Portland, Oregon 219.00-220.00 Cents per gallon Propane Prices Mont Belvieu……….…..non-TET………$1.100280 Cents per gallon 
Spot Ethanol prices have support from 150.00 to 157.00. It looks like it will take an extended period to turn this market back up, again. |